Tamadoge (TAMA/USD) Eyes Potential Rebound at $0.00036 Amid Rising Volatility
Estimated Reading Time: 3 minutes
Don’t invest unless you’re prepared to lose all the money you invest. This is a high-risk investment and you are unlikely to be protected if something goes wrong. Take 2 minutes to learn more
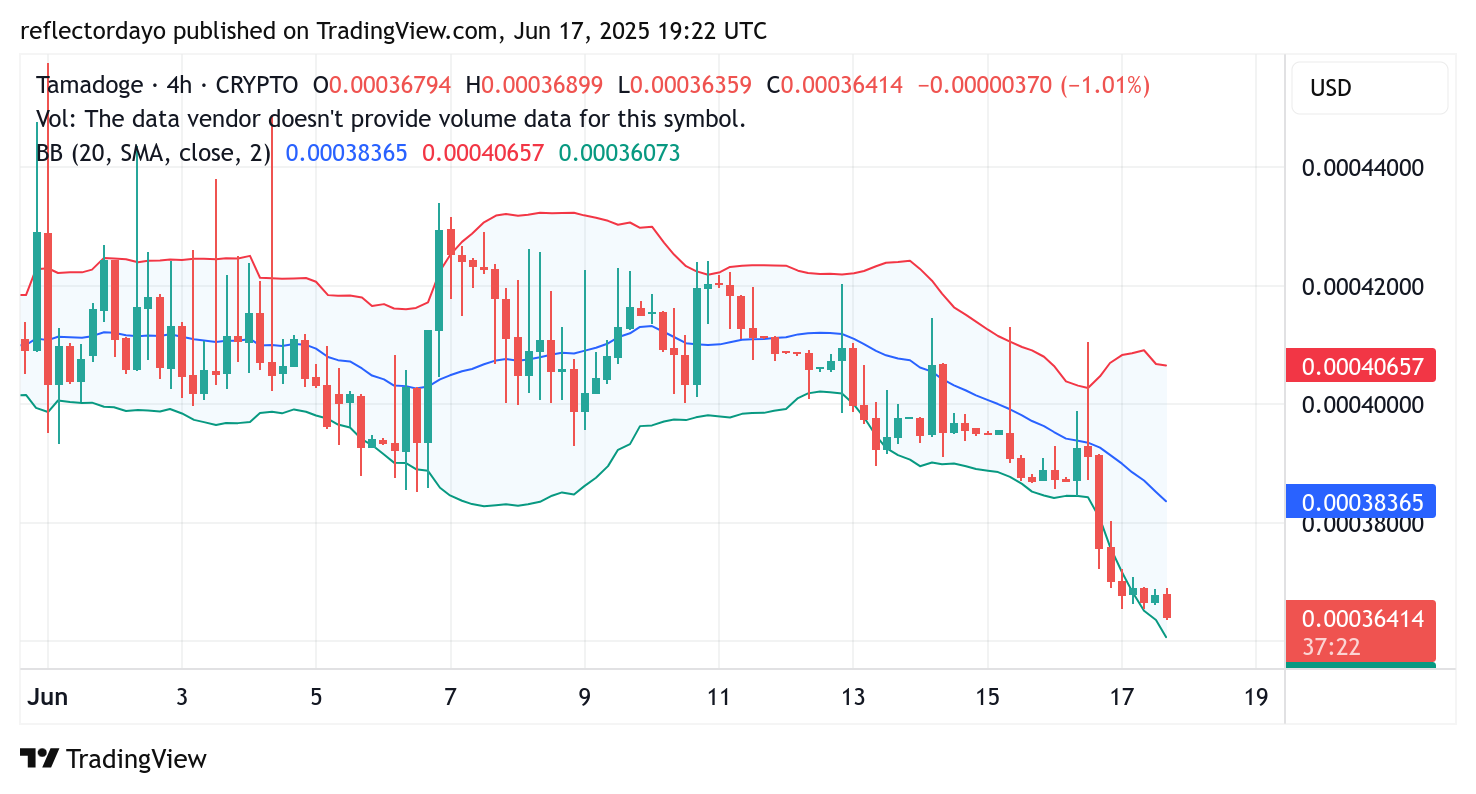
Persistent bearish pressure has gradually forced Tamadoge (TAMA/USD) to retreat from key support levels at $0.00040 and $0.00038, with bulls now focusing on a potential rebound near the $0.00036 price zone.
Price action suggests that this level may offer some support. As the market approaches the $0.00036 threshold, we’ve seen signs of minor rejections—an indication that sellers may be losing steam and some traders are beginning to adopt a bullish stance. Notably, the price recently found temporary support at $0.0003667, though this level is currently under threat amid ongoing bearish momentum.
Key Price Zones to Watch
- Resistance: $0.00045, $0.00050, $0.00055
- Support: $0.00035, $0.00030, $0.00025
TAMA/USD Technical Outlook: Volatility Builds as Bulls Eye $0.00036 for Reversal
Technical indicators are beginning to hint at a potential bullish shift in Tamadoge’s (TAMA/USD) market structure. The Bollinger Bands are expanding, signaling rising volatility, with the price consistently testing the lower band—a reflection of sustained bearish pressure.
However, this increase in volatility may open the door for a rebound. Should buyers step in at the $0.00036 level, they could capitalize on the heightened market activity to drive a recovery. This price zone now stands as a critical inflection point. A firm hold or bounce from this level may mark the beginning of a bullish reversal, making it a key area to monitor closely in the coming sessions.
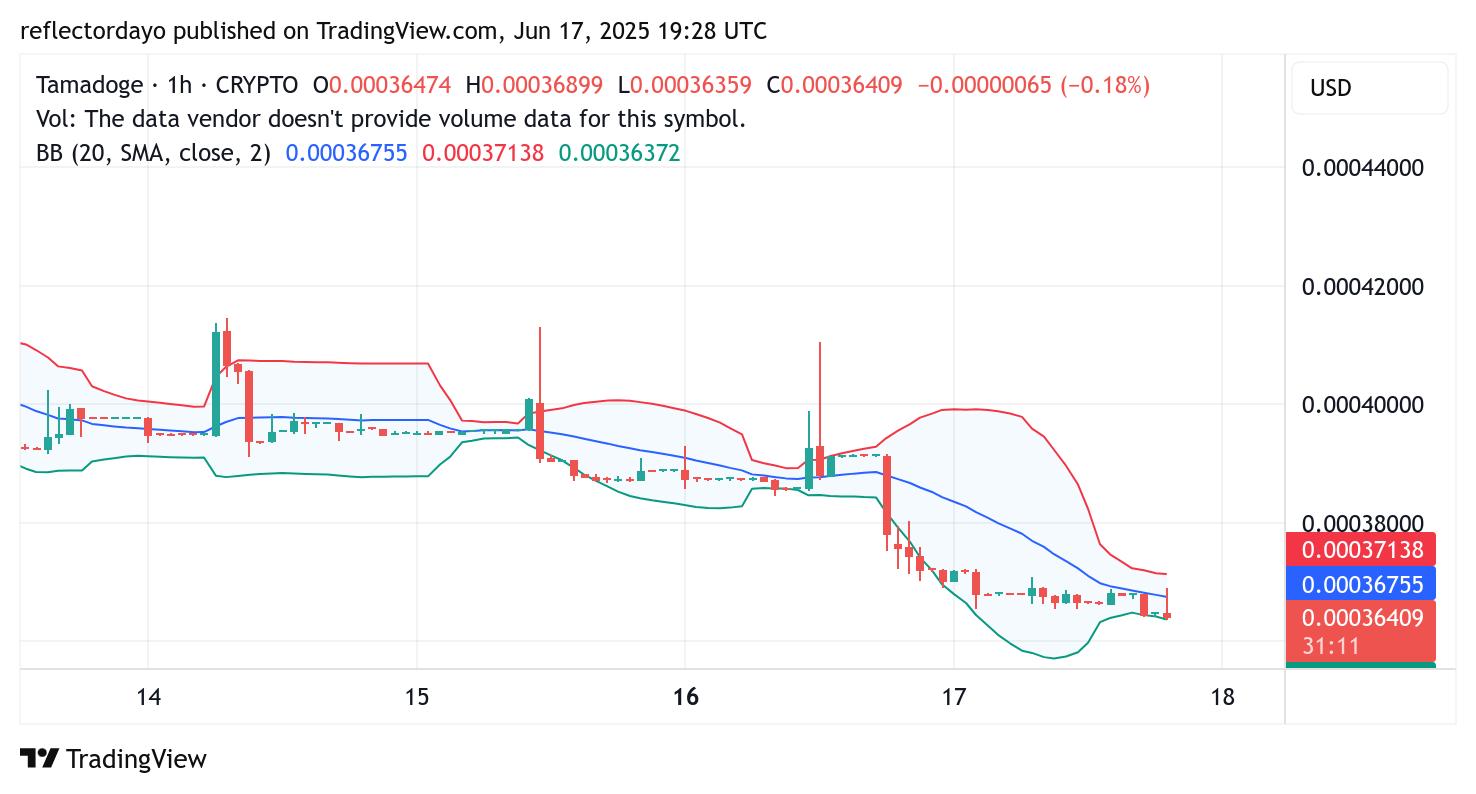
Tamadoge 1-Hour Chart: Bulls Anchor at Key Support Despite Gravestone Doji Formation
The 1-hour chart for TAMA/USD shows the emergence of a Gravestone Doji candlestick in the current session, a pattern often signaling a failed bullish attempt to drive the market higher. While this may reflect the bulls’ inability to sustain upward momentum, it also suggests that they are actively reinforcing their position around the crucial $0.00036 support level.
Although follow-through has been limited so far, the presence of this pattern near a critical support zone hints at building bullish interest. If buying pressure increases, a potential rebound could develop from this level in the near term.
Buy TAMA/USD!
There’s no mobile runner out there quite like #TamadogePursuit! 🏃♂️
1️⃣ Sign up – start with 20 free credits for a boost!
2️⃣ Climb up the leaderboards.
3️⃣ Win $TAMA rewards!Play Now! 👇
📱Android: https://t.co/Of8SYALRzL
📱 iOS: https://t.co/IthvqovwAH pic.twitter.com/84HNqob9Rf— TAMADOGE (@Tamadogecoin) September 10, 2024