Tamadoge (TAMA/USD) Continues to Defend Critical Support
Estimated Reading Time: 3 minutes
Don’t invest unless you’re prepared to lose all the money you invest. This is a high-risk investment and you are unlikely to be protected if something goes wrong. Take 2 minutes to learn more
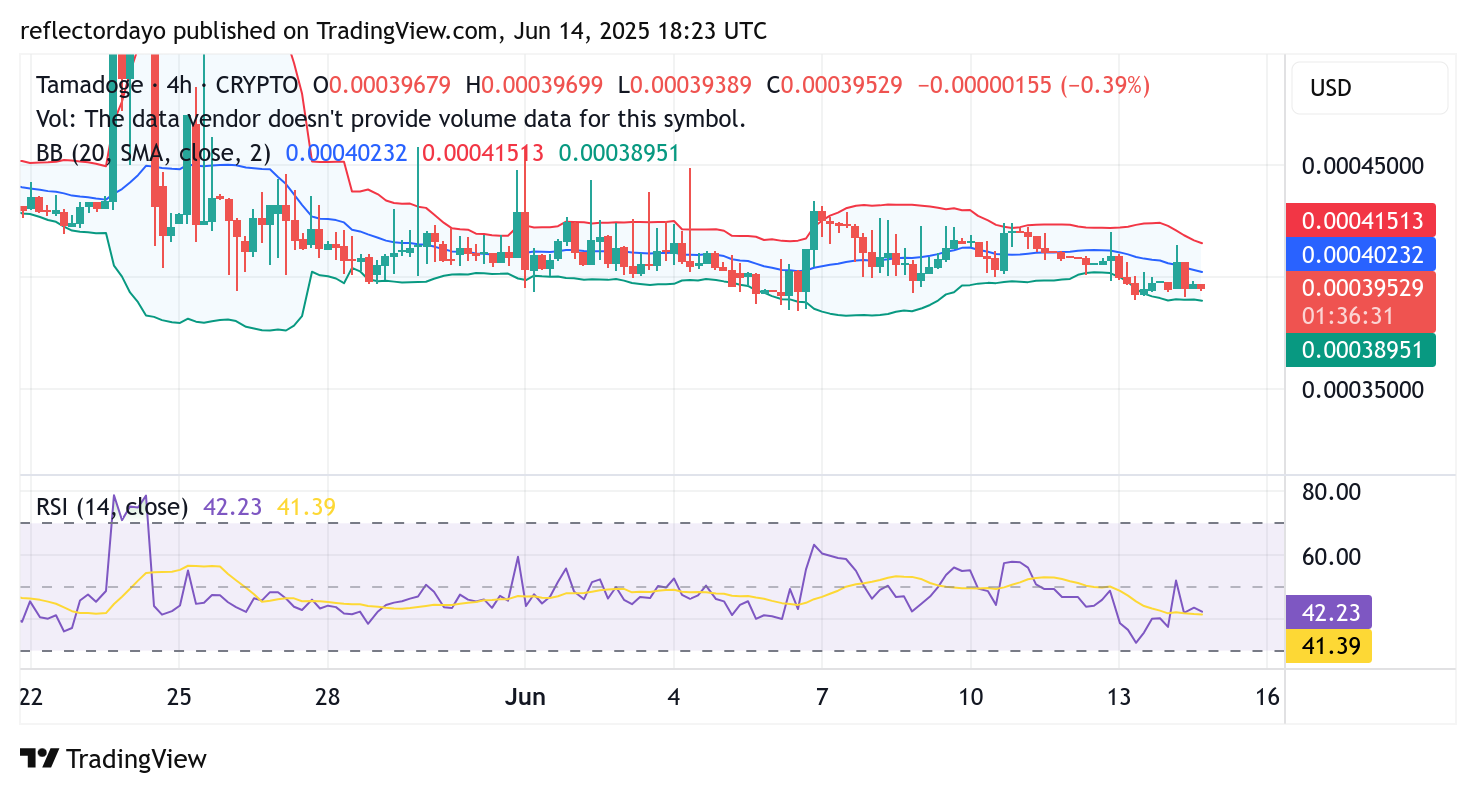
Tamadoge (TAMA/USD) is showing notable resilience as it continues to hover around the key $0.0004 support level, despite sustained bearish pressure. Although the market briefly dipped below this threshold, the bulls have managed to maintain a defensive stance, reflecting their determination to keep the price afloat.
Earlier in the session, the price made a strong attempt to push above the $0.00041 level but faced firm rejection, leading to a pullback toward the $0.0004 zone. As selling pressure intensified, the bulls retreated slightly, establishing a temporary support at $0.00039. This shift has effectively turned the $0.0004 level into a new resistance barrier.
For a bullish reversal to take hold, buyers must reclaim and break above the $0.0004 level with conviction. Until then, the market remains vulnerable to further downside pressure.
Key Price Zones to Watch
- Resistance: $0.00045, $0.00050, $0.00055
- Support: $0.00035, $0.00030, $0.00025
Tamadoge Technical Outlook: Early Signs of a Bullish Turn Emerging
Tamadoge‘s recent struggle beneath the $0.0004 support has left traders on edge, but technical cues now suggest a possible bullish resurgence. The formation of indecisive candlesticks in the current range indicates mounting resistance from buyers, even as bearish attempts persist.
The Relative Strength Index (RSI) is nearing oversold conditions, a classic signal that the selling may be overdone. Additionally, the crypto signal hovering around the lower Bollinger Band supports the case for a technical bounce. Together, these indicators hint at a market that’s ripe for a rebound.
However, the $0.0004 threshold now acts as a near-term resistance level. A convincing move above this barrier would serve as confirmation of renewed bullish momentum, potentially triggering fresh buying interest.

Intraday Technical Outlook—1-Hour Chart: TAMA Consolidates at $0.0004 as Market Seeks Direction
On the 1-hour chart, Tamadoge (TAMA/USD) continues to exhibit a tight battle between bullish and bearish forces. While sellers have maintained a slight advantage, technical indicators are increasingly favoring a potential bullish shift.
In the previous analysis, we highlighted the market’s approach toward the oversold zone. As anticipated, the price rebounded and rallied back to the $0.0004 level, which now acts as a temporary equilibrium between buyers and sellers.
If both sides continue to defend their positions around this level, market volatility may begin to contract—often a precursor to a significant directional breakout. Traders should stay alert for any decisive move that could set the tone for the next phase of price action.
Buy TAMA/USD!
There’s no mobile runner out there quite like #TamadogePursuit! 🏃♂️
1️⃣ Sign up – start with 20 free credits for a boost!
2️⃣ Climb up the leaderboards.
3️⃣ Win $TAMA rewards!Play Now! 👇
📱Android: https://t.co/Of8SYALRzL
📱 iOS: https://t.co/IthvqovwAH pic.twitter.com/84HNqob9Rf— TAMADOGE (@Tamadogecoin) September 10, 2024