$SPONGE (SPONGE/USD): Technical Indicators Flash Bullish Signal, Can Bears Be Stopped?
Estimated Reading Time: 3 minutes
Don’t invest unless you’re prepared to lose all the money you invest. This is a high-risk investment and you are unlikely to be protected if something goes wrong. Take 2 minutes to learn more

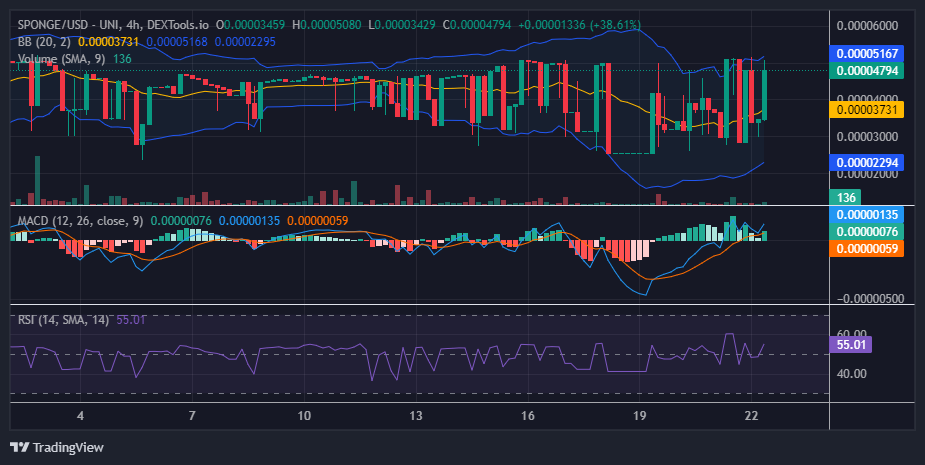
The resilience of the $SPONGE market is showing positive results, with prices advancing toward the $0.00005 level and entering seller territory due to strong bullish momentum. Historically, bears have established strong resistance, but bulls have repeatedly countered bearish attempts to drive the market down. Currently, the bears are once again resisting the bullish trend, causing the market to decline. Previous analysis indicated that the recent price surge might be unsustainable, as suggested by some of the crypto signal readings.
Key Market Dynamics:
- Resistance Levels: $0.0010, $0.0011, and $0.0012
- Support Levels: $0.000035, $0.000030, and $0.000025
$SPONGE (SPONGE/USD) Technical Outlook
Although recent price performance has influenced the Bollinger Bands, causing them to trend upward, some indicators suggest that the bullish momentum may not be sustainable. One reason for this is the current high market volatility combined with a lack of substantial trading volume to support the Marubozu candlestick pattern. Initially, bears had retreated slightly, reflecting the strong impact of recent bullish activities, but the price action is now correcting, pulling back to $0.0000479. Despite this, the overall crypto signal remains bullish as the market stays within bullish territory. If this $SPONGE market momentum can be consistently maintained, it may continue to exhibit upward traction.

SPONGE/USD 1-Hour Chart Insights
In the short term, the market has exhibited high volatility with notable price swings. The current 1-hour trading session features a strong bullish marubozu candlestick, indicating that bulls are still in control. However, a bearish trend is emerging following this bullish momentum. After a period of stagnation in the previous session, the market has begun trending downward. This decline may be a minor price correction, as indicated by the Bollinger Bands, which show the market was trading above the upper standard deviation curve, signaling an overbought condition. In such cases, a price correction is typical. During this correction phase, maintaining a stable support level is crucial.
Buy SPONGE/USD!
Brb, gotta go watch the $SPONGE chart 🧽💦💦 pic.twitter.com/Fcm5pDM8at
— $SPONGE (@spongeoneth) July 16, 2024