SPONGE (SPONGE/USD) Technical Analysis Hints at Bullish Return
Estimated Reading Time: 2 minutes
Don’t invest unless you’re prepared to lose all the money you invest. This is a high-risk investment and you are unlikely to be protected if something goes wrong. Take 2 minutes to learn more

The resilience of the SPONGE/USD market is starting to show results, with price action pushing towards the $0.00005 mark, encroaching into seller territory as bullish momentum drives prices above this level. Historically, bears have held strong at each resistance point, but the bulls have demonstrated resilience, consistently rejecting bearish attempts to push the market into a downtrend. This time, the market may be poised for another breakout.
Key Market Dynamics:
- Resistance Levels: $0.0010, $0.0011, and $0.0012
- Support Levels: $0.000035, $0.000030, and $0.000025
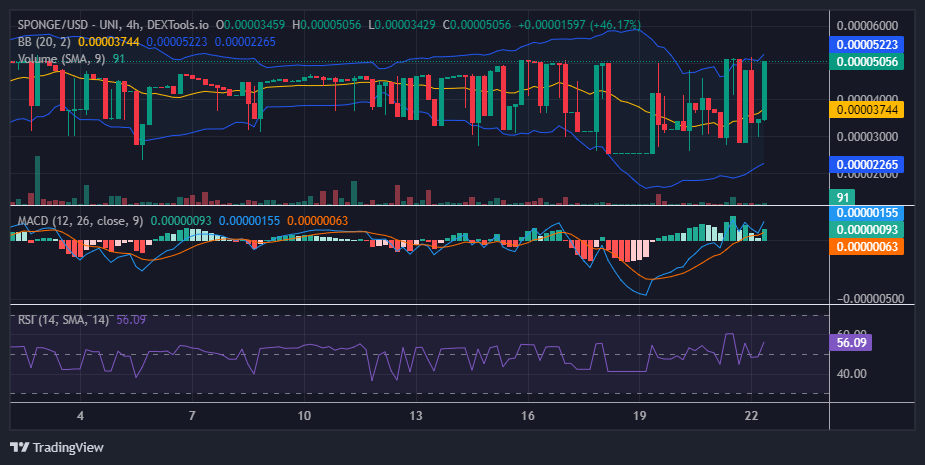
$SPONGE (SPONGE/USD) Technical Outlook
The recent impressive performance of the bulls has caused the Bollinger Bands to trend upwards after surpassing the $0.00005 price level. The bears have made a marginal retreat, indicating a weakening bearish position. This crypto signal may encourage further bullish sentiment as prices break above the resistance level.
Additionally, indicators are signaling bullish momentum, with the two MACD lines crossing above the zero level on the Moving Average Convergence and Divergence (MACD) indicator. However, this ongoing bull run may soon fade due to the very low trading volume, which undermines the current market momentum. The low trading volume might also be contributing to the market’s high volatility.
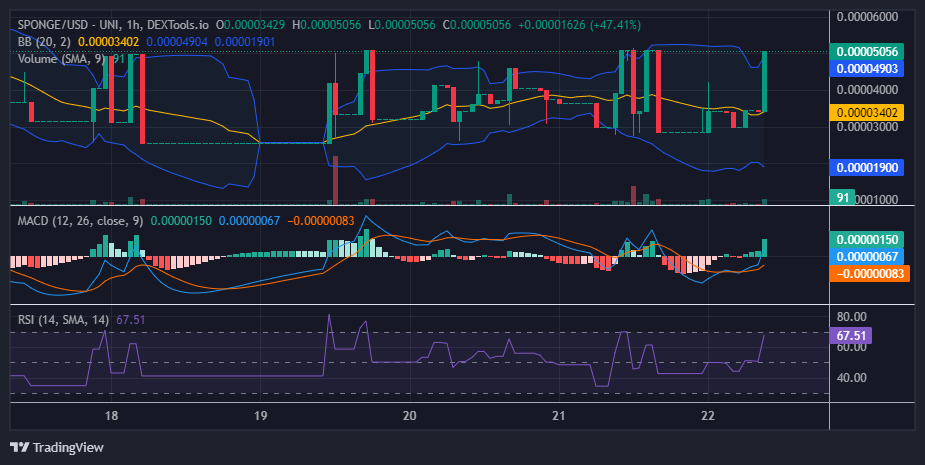
$SPONGE 1-Hour Chart Insights
From a short-term perspective, the market has been highly volatile with wide price oscillations. In the current 1-hour trading session, a strong bullish marubozu candlestick indicates that bulls are still in control. However, traders should watch for the establishment of a near support level around the $0.00005 mark, as a price pullback is likely. Given the current volatility, this correction may be significant. However, maintaining a steady position near this level could signal that the bulls are leveraging the current run to secure a bullish trend and rally.
Buy SPONGE/USD!
When someone tells you to stop buying $SPONGE 🧽💦 pic.twitter.com/h7cCUtLUVE
— $SPONGE (@spongeoneth) July 20, 2024