The dYdX Market (DYDX/USD) Signals Bullish Momentum Around the $1.55 Support Level
Estimated Reading Time: 3 minutes
Don’t invest unless you’re prepared to lose all the money you invest. This is a high-risk investment and you are unlikely to be protected if something goes wrong. Take 2 minutes to learn more

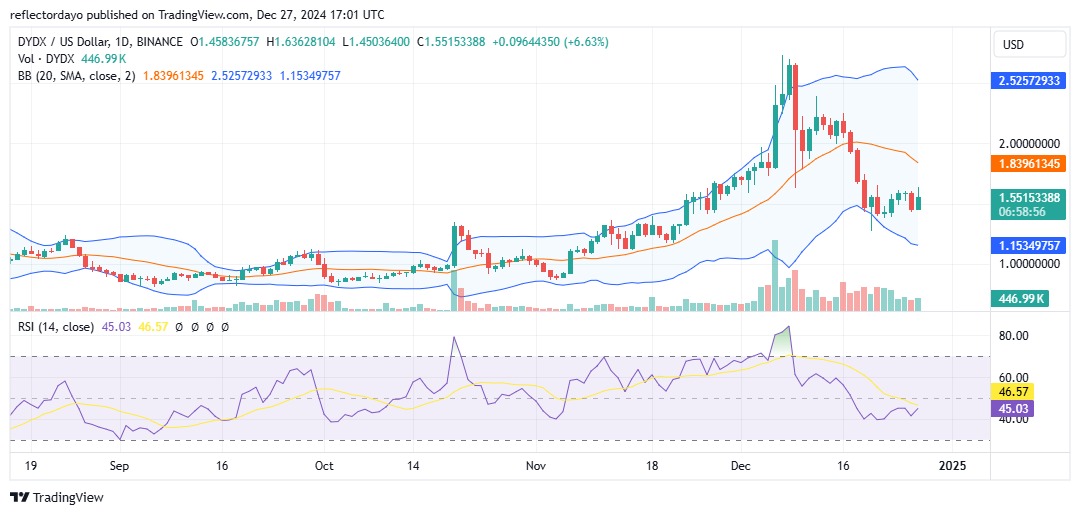
The dYdX market is showing signs of a potential bullish bias at the $1.55 price level. This critical price point represents a zone where the struggle between demand and supply has intensified, following a bearish decline from the $2.80 high. The earlier surge to $2.80 was driven by strong buying pressure, which pushed the market to this level in the first half of December. However, heightened market volatility during that period led to significant profit-taking activity, driving prices lower. Now, the emergence of bullish momentum at $1.55 suggests a possible shift in market sentiment.
The dYdX Market Data
- DYDX/USD Price Now: $1.551
- DYDX/USD Market Cap: $1.1 billion
- DYDX/USD Circulating Supply: 712 million
- DYDX/USD Total Supply: 774 million
- DYDX/USD CoinMarketCap Ranking: #88
Key Levels
- Resistance: $2.00, $2.50, and $3.00
- Support: $1.50 $1.00, and $0.950
The dYdX Market Through the Lens of Indicators
Following the initial profit-taking, a bearish run was triggered. Along the way, the bears encountered resistance at the $2.00 price level, where bullish momentum temporarily slowed their advance. However, the bears ultimately regained control, leading to a breakdown at $2.00 and an aggressive decline that pushed the market down to $1.50.
At the $1.50 level, the dYdX market has shown signs of a potential bounce, as bullish activity has persisted for nearly 20 days. The repeated rejection of bearish attempts at this level establishes it as a strong support zone, reinforcing the possibility of a rebound.
Currently, the Bollinger Bands indicate heightened market volatility. However, if the ongoing consolidation at $1.50 continues, volatility is likely to decrease, setting the stage for a significant price movement. Traders should monitor the crypto signal closely at this level to identify opportunities and make informed decisions.
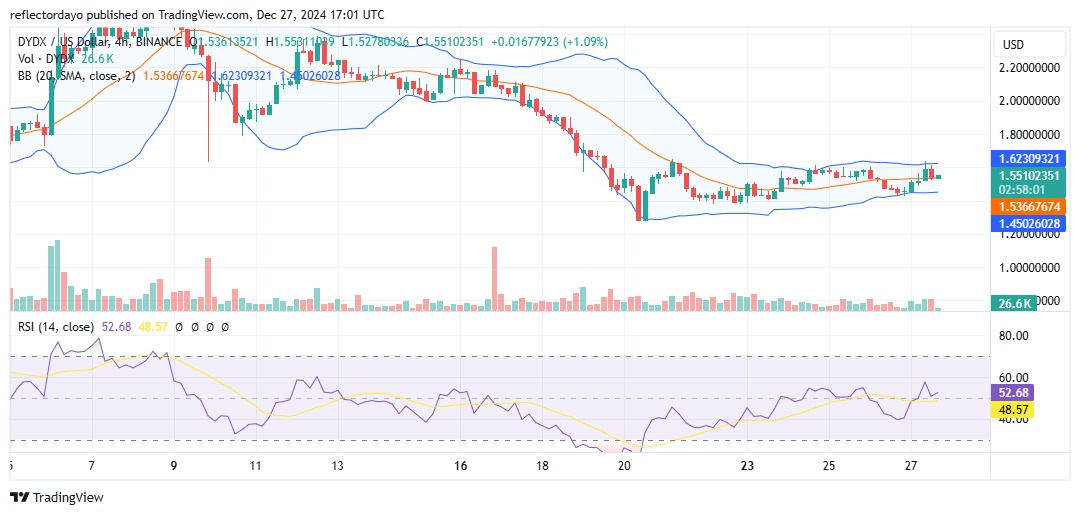
DYDX/USD Price Prediction: 4-Hour Chart Analysis
From the perspective of the 4-hour chart, the market shows that bulls initiated a bounce at the $1.45 price level. Since this pivotal moment, bullish activity has steadily converged around this zone, driving gradual upward momentum. However, bearish pressure persists, contributing to the slower pace of the bullish advance.
The Bollinger Bands are narrow, indicating a balance between supply and demand. Despite this equilibrium, bullish sentiment slightly outweighs bearish sentiment, resulting in the market’s gradual ascent.
Currently, the $1.60 price level stands as a key resistance zone. Traders should monitor this level closely, as a breakout above it could attract additional bullish momentum, propelling the market further upward.