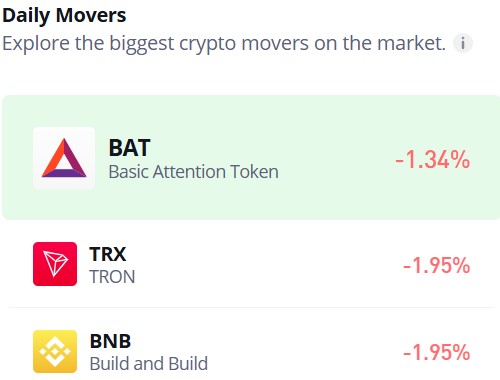
Basic Attention Token (BAT/USD) Surges Back Above the $0.25 Benchmark
Estimated Reading Time: 3 minutes
Don’t invest unless you’re prepared to lose all the money you invest. This is a high-risk investment and you are unlikely to be protected if something goes wrong. Take 2 minutes to learn more
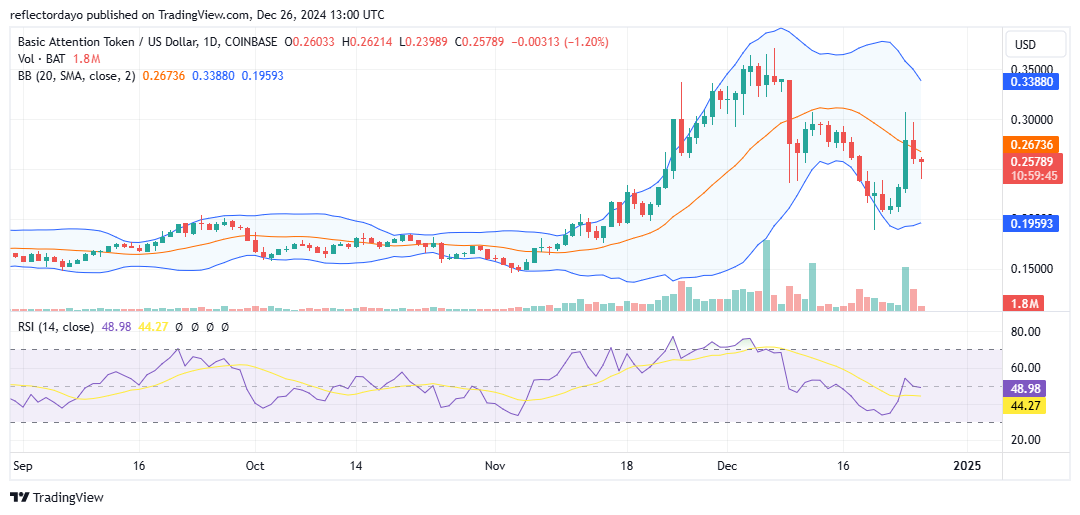
After a bearish trend was triggered at the high of $0.35, causing descending price peaks, the bulls of Basic Attention Token (BAT) began stepping in at the $0.20 price level. Since finding pivotal support at $0.20, there has been a significant bullish recovery. The bulls successfully broke the first descending resistance level on their path to recovery, with the price surging above the critical $0.25 level, previously dominated by bearish pressure.
Now that the market has risen significantly above this threshold, peaking near the $0.30 level, the subsequent bearish correction from $0.30 was cut short at $0.25 as bullish momentum consolidated around this level. This demonstrates the growing strength of the bulls.
Basic Attention Token Market Data
- BAT/USD Price Now: $0.2547
- BAT/USD Market Cap: $374.3 million
- BAT/USD Circulating Supply: 1.5 billion
- BAT/USD Total Supply: 1.5 billion
- BAT/USD CoinMarketCap Ranking: #180
Key Levels
- Resistance: $0.30, $0.35, and $0.40
- Support: $0.25, $0.20, and $0.15.
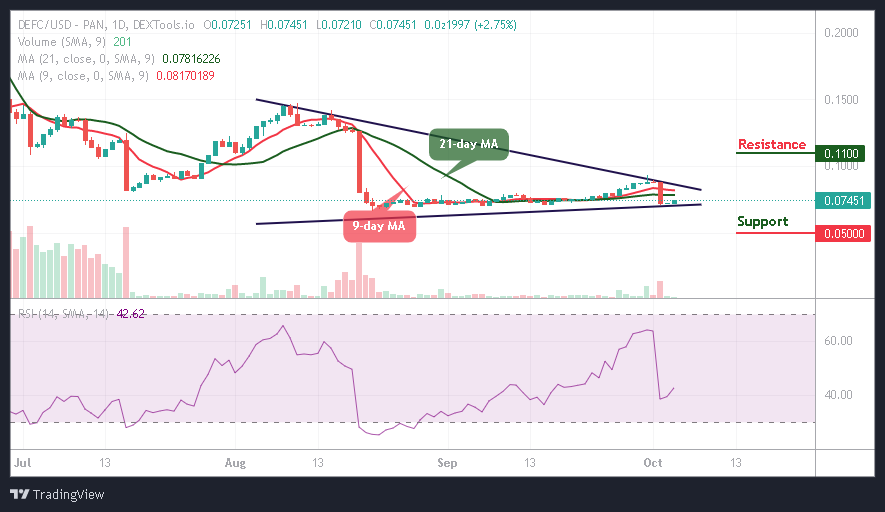
Price Analysis for Basic Attention Token: The Indicators’ Point of View
The Bollinger Bands indicate substantial bandwidth, reflecting a high level of market volatility. Despite this, the bulls have demonstrated resilience by defending the $0.25 price level, preventing the bearish trend from fully eroding the gains made during the previous bullish run.
In today’s daily trading session, the candlestick pattern provides further insight into Basic Attention Token market dynamics. A hammer candlestick has formed, often indicative of brewing bullish momentum. This pattern suggests ongoing bullish activity or bias around the $0.25 price level.
If bearish pressure persists, the price action could transition into a consolidation phase, as the bulls at this level continue to exhibit strength. This scenario in the crypto signal underscores the potential for stability around the $0.25 level as both sides vie for control.
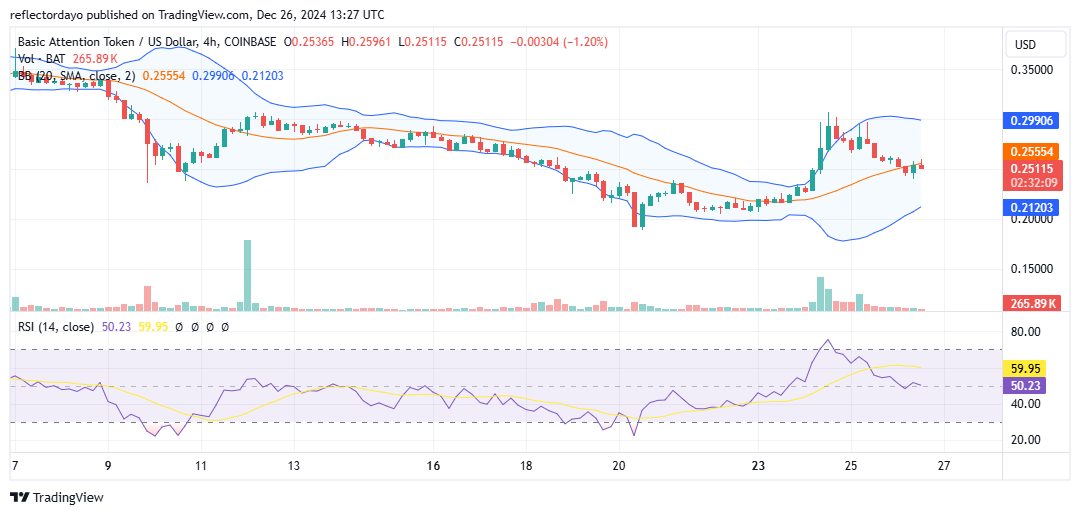
BAT/USD 4-Hour Chart Outlook
Zooming into the 4-hour chart, the buyers’ position at the $0.25 price level appears strong, suggesting a potential bounce from this critical support. This optimism stems from the bulls’ ability to defend and rebound at progressively higher levels, demonstrating their growing strength.
However, analyzing the market from another perspective reveals a convergence of bullish and bearish forces at the $0.25 level. Additionally, the consistent decline in the trade volume histogram height suggests that the market may be entering a period of volatility compression. Such a “volatility squeeze” often precedes a significant price movement, which is likely to result in a bounce, rally, or upward market performance.