Uniswap (UNI) Price Prediction: UNI/USDT Upside Rebound Comes Under Pressure
Estimated Reading Time: 2 minutes
Don’t invest unless you’re prepared to lose all the money you invest. This is a high-risk investment and you are unlikely to be protected if something goes wrong. Take 2 minutes to learn more

Uniswap (UNI) Price Prediction: August 8
The Uniswap market recently crashed through multi-year support at the $5.00 mark but soon retracted upward. Today’s trading activity has shown a moderate upward correction. However, the market may still be vulnerable given its current position.
UNI/USDT Long-term Trend: Bullish (Daily Chart)
Key Price Levels:
Resistance Levels: $7.00, $8.00, and $9.00
Support Levels: $6.00, $5.00, and $4.00
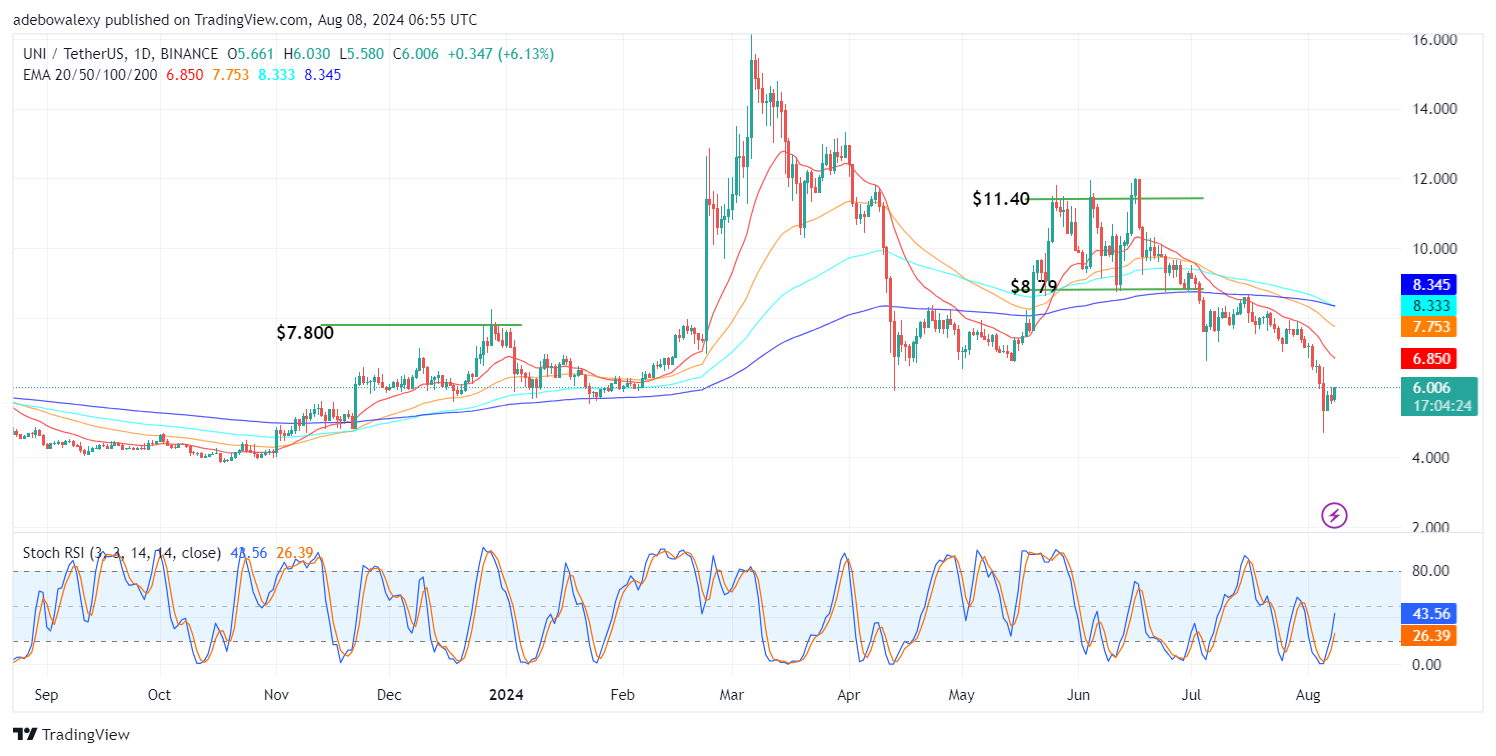
Uniswap’s price action is currently correcting upward but remains below all the Exponential Moving Average (EMA) lines. The last price candle on this daily chart under consideration lacks upper and lower shadows, suggesting that price movements haven’t come under pressure either below or above. Additionally, the Stochastic Relative Strength Index (SRSI) indicator lines are still rising from below the 50 level.
Uniswap Price Prediction: UNI/USDT Is Still Vulnerable
The ongoing session in the Uniswap market has witnessed some impressive moves. However, this hasn’t erased the fact that it still lies in what we may call bearish territory.
This opinion stems from the fact that the token still trades below all the EMA lines. Also, the SRSI indicator lines are still below the 50 mark. Considering the current position of the market and the SRSI indicator lines, one might still want to exercise caution concerning bullish speculations in this market.
Uniswap Price Prediction: The UNI/USDT Market May Have Found Higher Support (4H Chart)
Price action in the UNI/USDT market has rebounded upwards off higher support in the 4-hour market. This has also propelled the market past the 20-day EMA line. Similar to what we have observed on the daily chart, the last price candle here also lacks upper and lower shadows.
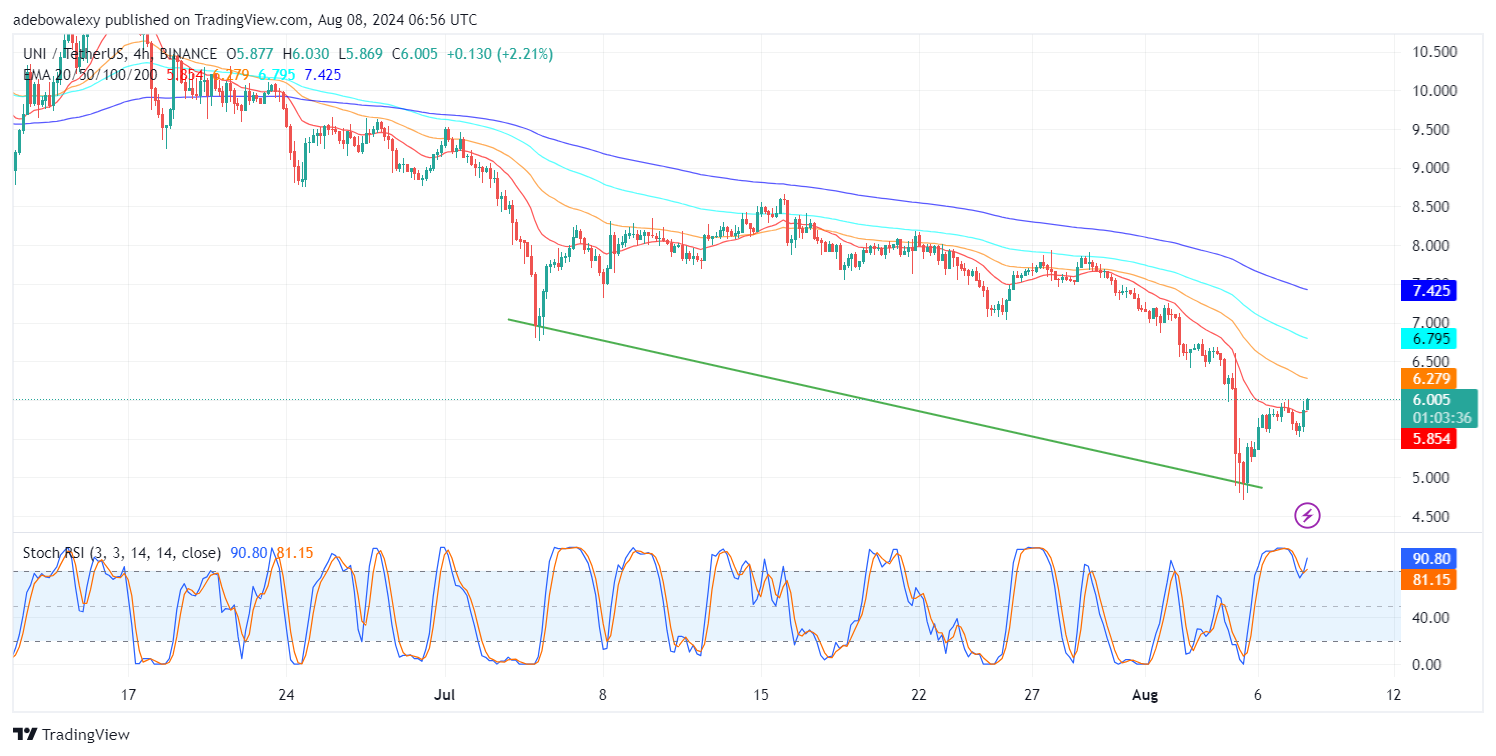
Nevertheless, it stands above the 20-day EMA curve. Also, the SRSI indicator lines have delivered a bullish crossover at the 80 mark. The ensuing lines have moved further upwards and align with the current trend in the market. Given the current trend, it appears that this market may present short-term gains toward the $6.50 mark.