Bitcoin (BTC) Price Prediction: BTC/USDT Upside Rebound Comes Under Pressure
Estimated Reading Time: 3 minutes
Don’t invest unless you’re prepared to lose all the money you invest. This is a high-risk investment and you are unlikely to be protected if something goes wrong. Take 2 minutes to learn more

Bitcoin (BTC) Price Prediction: August 7
Bitcoin recently dipped below the $50,000 threshold but soon reversed upwards. The token now trades above the $55,000 price level and even above the $56,000 mark. Despite this, the market may still be at risk of another nosedive.
BTC/USDT Long-term Trend: Bullish (Daily Chart)
Key Price Levels:
Resistance Levels: $60,000, $65,000, and $70,000
Support Levels: $55,000, $50,000, and $45,000
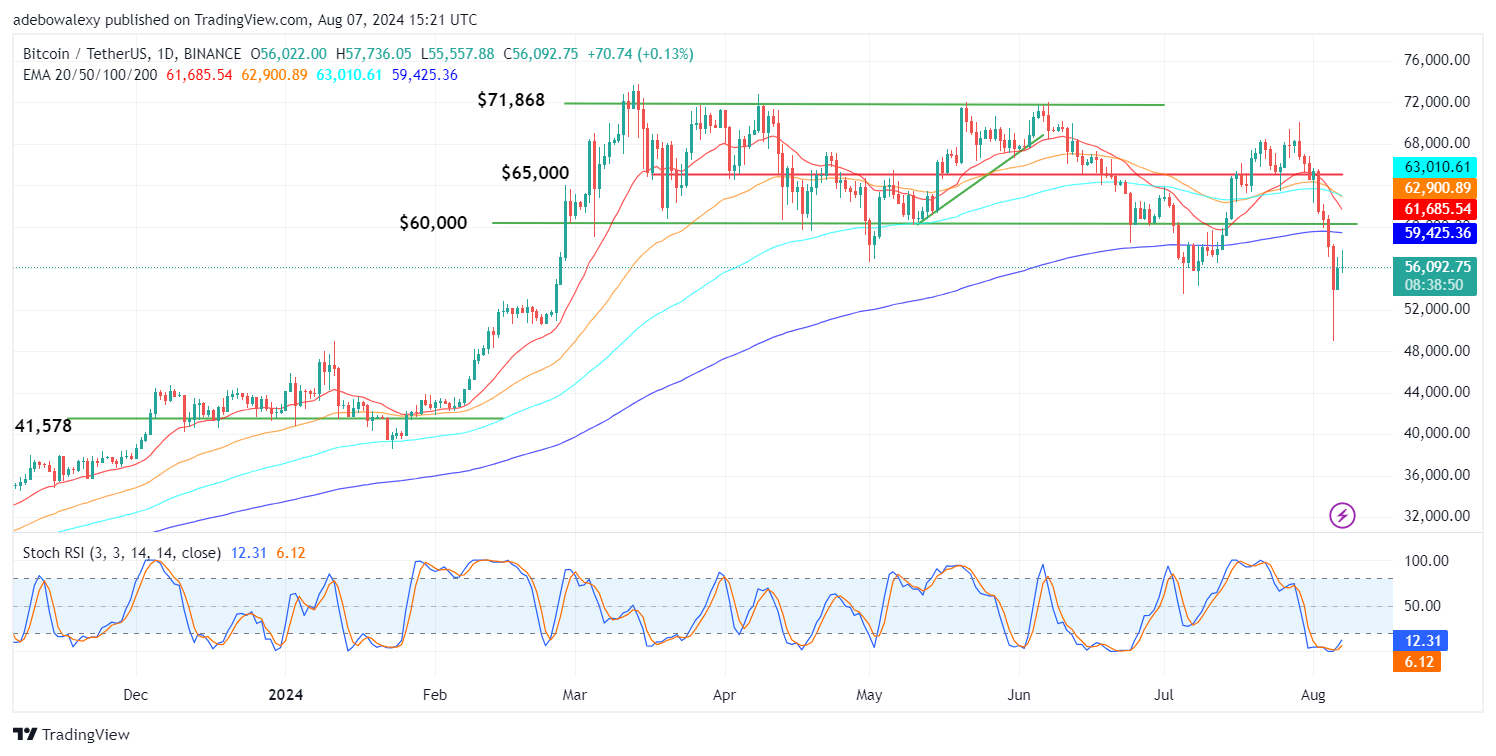
On the daily BTCUSDT price chart, it can be seen that the recorded gains in today’s trading activity are about to be wiped out. Also, the corresponding price candle still lies below all the Exponential Moving Average (EMA) lines. While this is the case, the Stochastic Relative Strength Index (SRSI) indicator lines can be seen on an upward trajectory. This is striking because the session seems to have come under the effect of a downward forecast, which has caused a significant downward contraction.
Bitcoin Price Prediction: BTC/USDT Bleeds Out
The Bitcoin daily market had earlier demonstrated a continued upward correction today. What’s more, the length of the upper shadow of the last price candle on this chart reveals that price movement has been moderately volatile. However, that has changed as headwinds caused buyers to relinquish their gathered gains.
The posting of price action in this market below all the EMA curves suggests that the market may still fall lower. Meanwhile, the SRSI lines are still rising upward from the oversold region. Be that as it may, it seems safer to go with the trend of the market and anticipate that prices may fall lower.
Bitcoin Price Prediction: The BTC/USDT Market Sees a Smooth Rejection Off the 20-Day EMA Line (4H Chart)
After price action in the BTCUSDT market bounced off the support around the $50,000 mark, the market has proceeded upwards. However, it can be observed that price volatility seems to be reducing as the market approaches the 20-day EMA curve. In the ongoing session, bears have regained control and have printed a moderate downward correction.
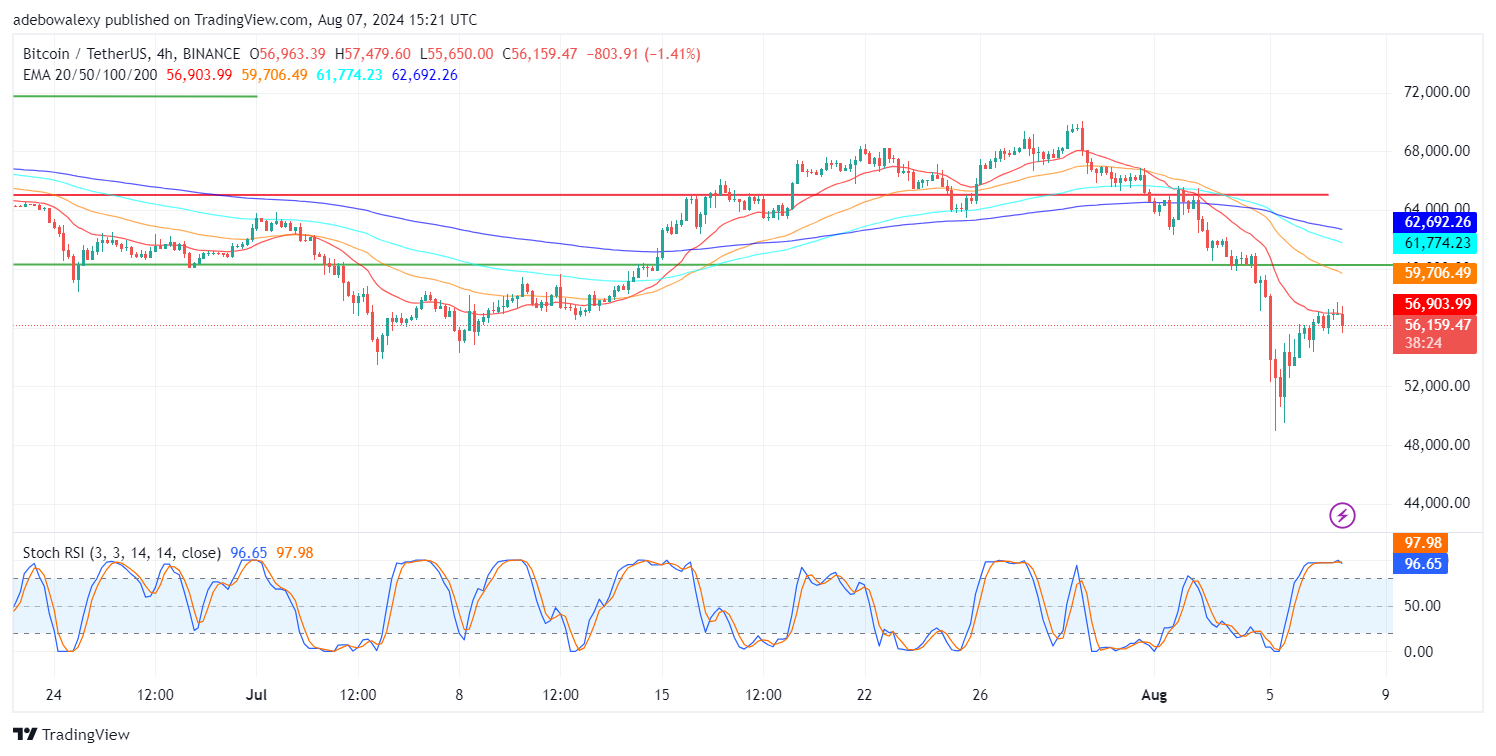
Likewise, the SRSI indicator lines have reached the 100 mark of the overbought region and have now taken a downward path. Technically, indications arising from this market hint that the market may have staged a downward correction. Also, volatility seems healthy and may assist bears in printing some decent gains, and the market may revisit price levels below the $55,000 threshold.