Litecoin (LTC) Price Prediction: LTC/USDT Upside Rebound Comes Under Pressure
Estimated Reading Time: 3 minutes
Don’t invest unless you’re prepared to lose all the money you invest. This is a high-risk investment and you are unlikely to be protected if something goes wrong. Take 2 minutes to learn more
Litecoin (LTC) Price Prediction: August 6
The Litecoin market had earlier recovered a bit. This happened as Bitcoin’s price reversed upwards after poking through the $50,000 support. However, it appears that headwinds have once again been kindled, Litecoin’s price in the session have witnessed a significant downward compression.
LTC/USDT Long-term Trend: Bearish (Daily Chart)
Key Price Levels:
Resistance Levels: $60, $70, and $80
Support Levels: $50, $40, and $30
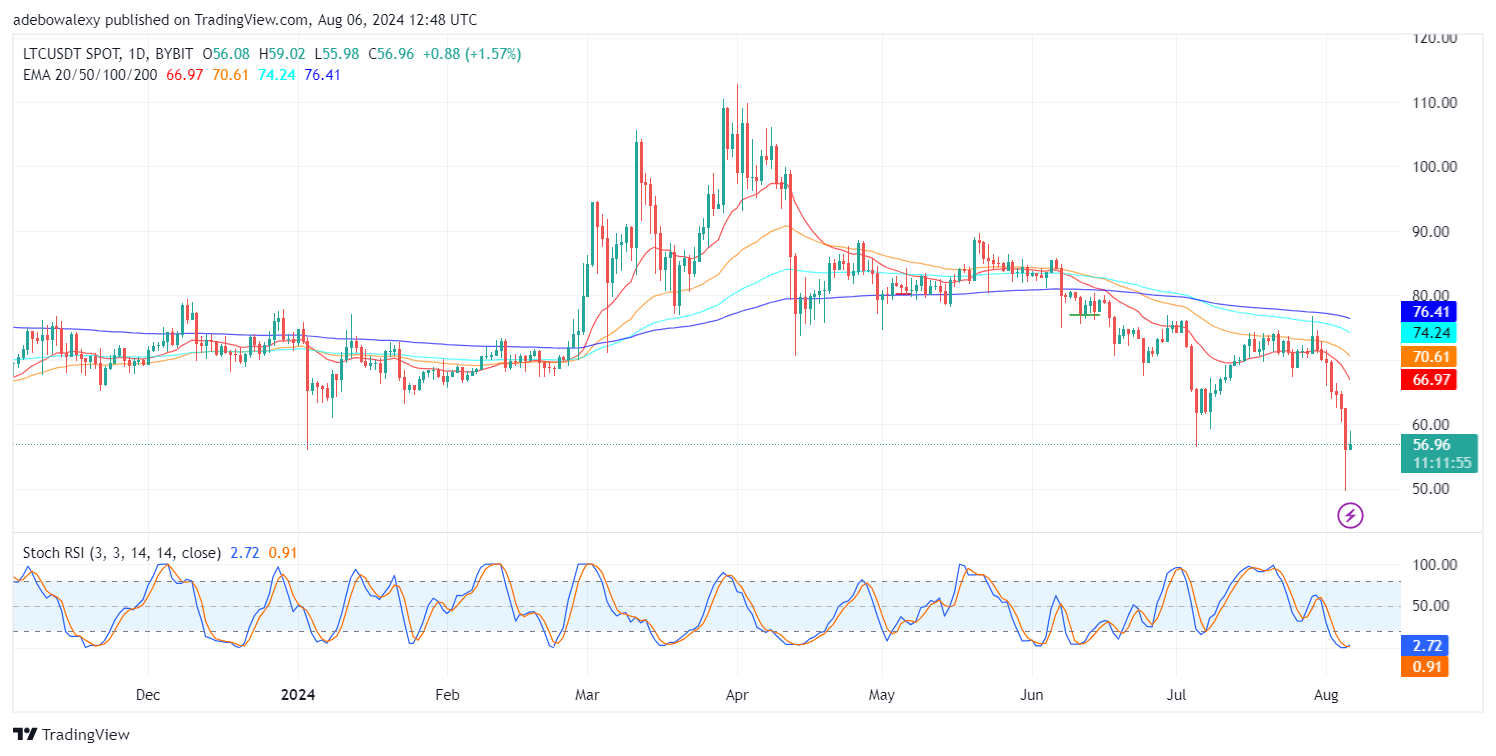
The perceived downward compression seems normal, as the corresponding price candle to the ongoing session lies below all the Exponential Moving Average (EMA) curves. Meanwhile, the Stochastic Relative Strength Index (SRSI) lines have delivered an upward crossover in the oversold region. Also, it should be observed that despite the significant compression, the SRSI indicator lines maintain their upward crossover.
Litecoin Price Prediction: The LTC/USDT Market Manages to Hold onto Upside Prospect
Price movement in the LTC/USDT daily market has upside promise but is up against serious challenges. Since price action lies at a significant distance below the EMA lines, upside forces will first have to rise past all the EMA lines one after the other. Meanwhile, the upside crossover on the SRSI lines remains intact.
This holds a positive indication against the already seen downward contraction of price in the ongoing session. Consequently, prices may increase further, and traders hoping to go bullish should consider placing an entry above some or all of the EMA indicator lines.
Litecoin Price Prediction: The LTC/USDT Market Hits a Rejection Below the EMA Lines (4H Chart)
It was earlier noted that price action in the Litecoin market had corrected off support around the $50 mark. The said upside correction lasted for about five sessions straight. However, since the previous session, the market can be seen to have reversed a bit.
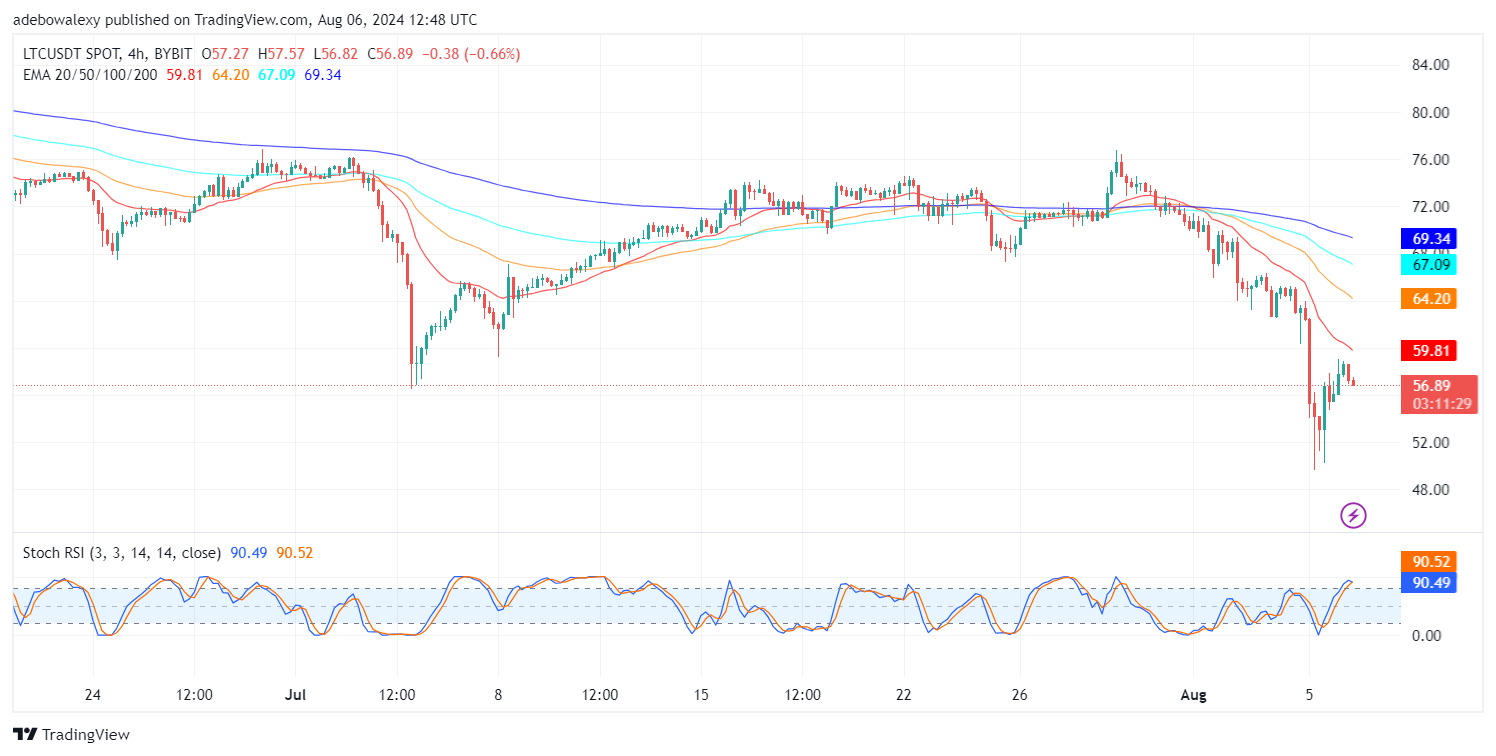
The SRSI indicator lines are still in the overbought region. Also, the trajectory of these indicator lines following a convergence suggests that upside forces may prove resilient. Whatever the case may be, it will be safer for traders to target higher price levels once price action crosses the $60 threshold at the least.