Dogecoin (DOGE) Price Prediction: DOGE/USDT Slumps Through Multiple Support Levels
Estimated Reading Time: 3 minutes
Don’t invest unless you’re prepared to lose all the money you invest. This is a high-risk investment and you are unlikely to be protected if something goes wrong. Take 2 minutes to learn more

Dogecoin (DOGE) Price Prediction: August 5
The Dogecoin market has witnessed an extended effect of downward forces. This started slowly but seems to have escalated as the bears stayed in control. Nevertheless, this holds a significant correlation to the massive price decline in the BTC market.
DOGE/USDT Long-term Trend: Bearish (Daily Chart)
Key Price Levels:
Resistance Levels: $0.09000, $0.1000, and $0.1100
Support Levels: $0.08000, $0.07000, and $0.06000

There has been a massive price decline in today’s trading activity for the Dogecoin token. While the price decline in past sessions was moderate and minimal, the ongoing session has seen a massive price descent. At this point, the DOGE/USDT market activity has occurred below the $0.08500 mark. This places the token’s price action at a significant distance below the Exponential Moving Average (EMA) lines. Meanwhile, the Stochastic Relative Strength Index (SRSI) lines can be seen glued to the 0.00 mark in the oversold region.
Dogecoin Price Prediction: The DOGE/USDT Market May See More Price Declines
While price activity has descended most significantly in the ongoing session, applied technical indicators hold that prices may yet fall lower. This opinion stems from the fact that Dogecoin now trades at a significant distance below the EMA curves, while the corresponding price candle for the ongoing session posts a huge profit for bearish traders.
Additionally, the lines of the SRSI indicator can be seen dragging sideways in the oversold region, revealing that bears are still maintaining strong dominance in the market. Consequently, traders can anticipate that the market may descend to lower support levels in the coming sessions.
Dogecoin Price Prediction: Bearish Momentum Seems Altered in the DOGE/USDT Market (4H Chart)
The DOGE/USDT market maintains a strong downward trajectory even in a 4-hour market time frame. However, the price candles in the past two sessions, and the one corresponding to the ongoing session project that bears may be facing some latent challenges. Nevertheless, price activity lies very burdened below the EMA indicator lines. Similarly, the SRSI leading indicator lines can be seen dragging in the depth of the oversold region.
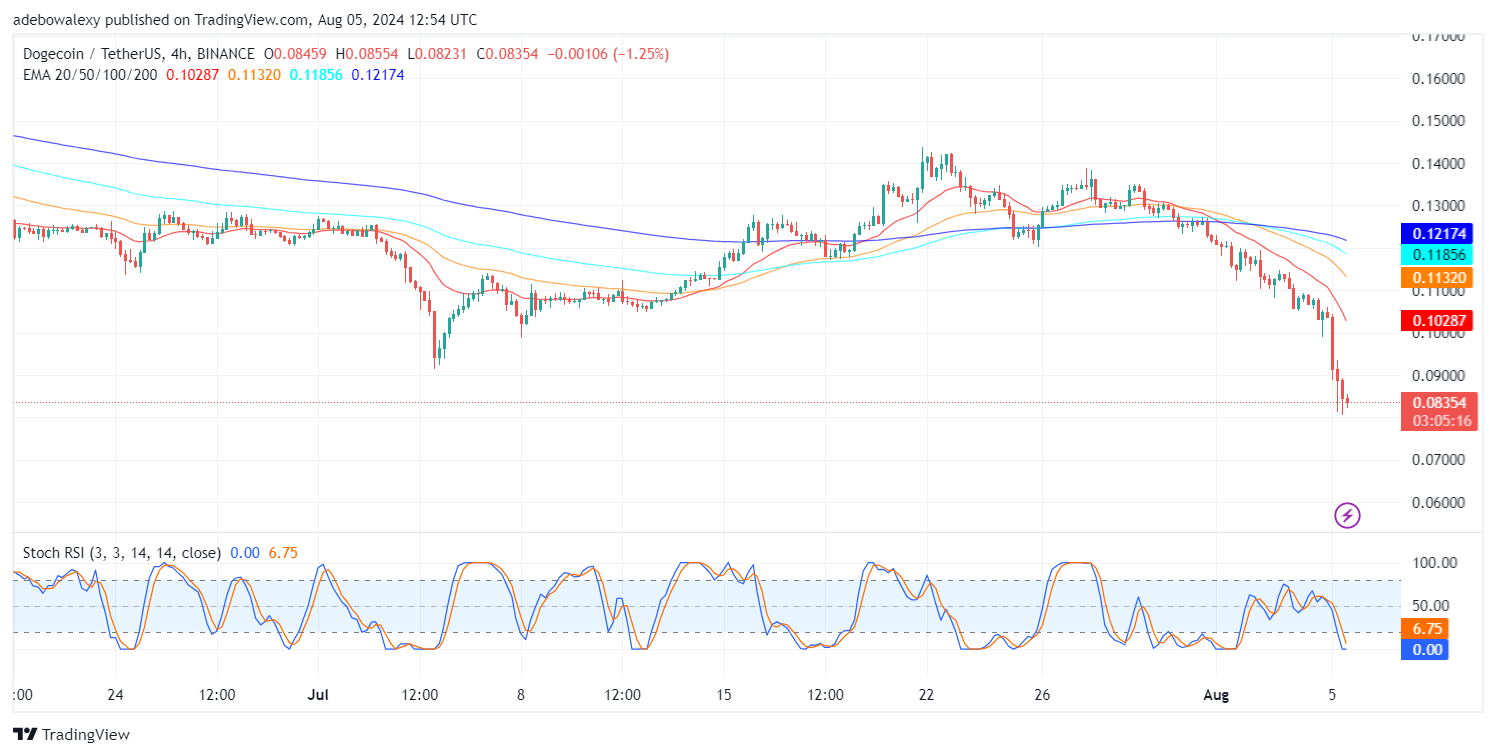
The overall appearance of price movement in this market supports bearish traders. However, the momentum in the market seems a bit haphazard, thereby giving the impression that downward forces are facing some challenges. Nevertheless, traders can still aim at the $0.08000 mark in this market.