Bitcoin (BTC/USD) Market May Attempt to Consolidate a Decline
Estimated Reading Time: 3 minutes
Don’t invest unless you’re prepared to lose all the money you invest. This is a high-risk investment and you are unlikely to be protected if something goes wrong. Take 2 minutes to learn more
Bitcoin Price Prediction – May 17
Sequence to the general valuation reduction process in the BTC/USD trade activities over time as the crypto market may attempt to consolidate a decline around the $27,000 that could potentially metamorphose into passing lower through variant support points. The price is at a minute negative percentage rate of 0.92, trading at $26,838.09. A frightening downward breakthrough at the $26,000 support line could indicate the start of a bearish trend.
BTC/USD Market
Key Levels:
Resistance levels: $28,000, $29,000, $30,000
Support levels: $26,000, $25,000, $24,000
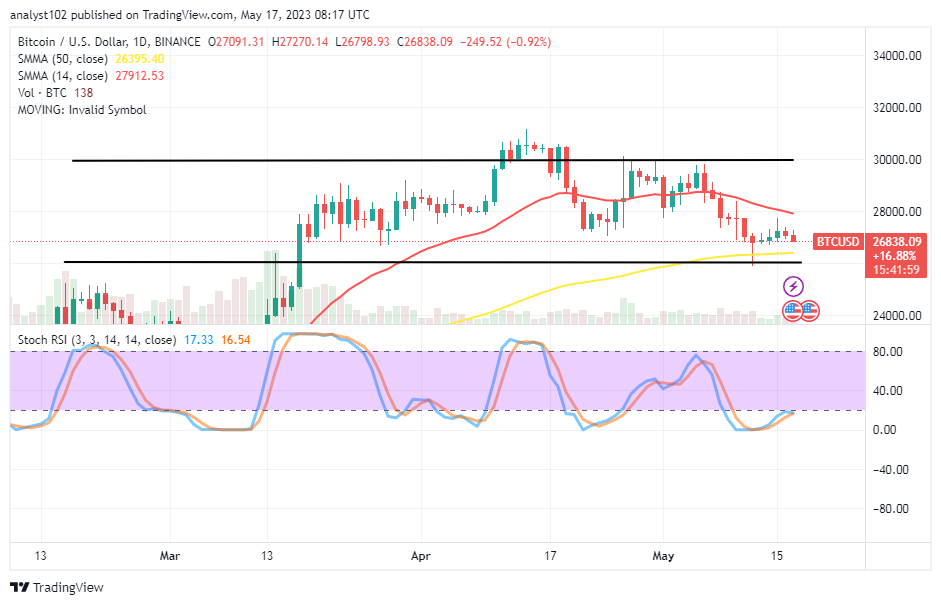
BTC/USD – Daily Chart
The BTC/USD daily chart reveals the crypto-economic market may attempt to consolidate a decline against the trend line of the larger SMA in the following days’ operations. The 14-day SMA indicator is at $27,912.53 at the top of the 50-day SMA indicator, which is at $26,395.40. The Stochastic Oscillators are at 17.33 and 16.54 levels, somewhat making an effort to cross back southbound against those points.
What’s the reading stance of the 14-day SMA above the 50-day SMA currently in the BTC/USD portend?
The smaller SMA’s reading stance over the bigger SMA concerning the trading transactions between Bitcoin and the US coin signifies that some falls will be under the resistance line of $28,000 as it has been that the price may attempt to consolidate a decline. However, if bulls muster up momentum around the support line at $26,000, they will push upside past the former indicator to recover some lost profits.
On the downside of the BTC/USD technical analysis, the present consolidation trend force has to enforce an intensity to make sure that any resistance around the $28,000 aimed not to breach by bulls’ aftermath degree of responsiveness positively in a rallying motion if bears to hold their stances beyond the $26,000 support point in the long-term run.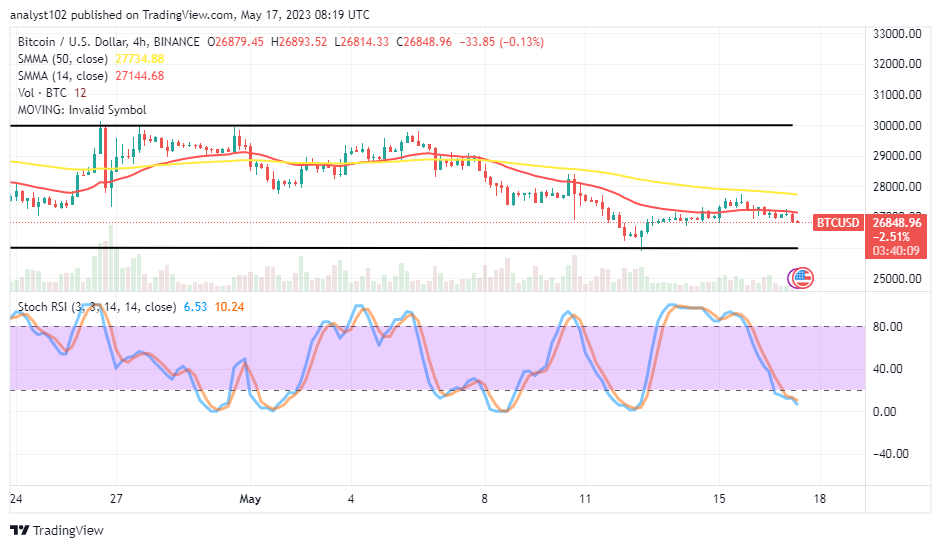
BTC/USD 4-hour Chart
The BTC/USD medium-term chart showcases that the crypto-economic market may attempt to consolidate a decline, as a series of smaller 4-hour candlesticks formed slightly southward across the smaller indicator. The 50-day SMA indicator is above the 14-day SMA indicator. The Stochastic oscillators have dipped into the oversold region at 10.24 to 6.53 levels, indicating the market is exposed to a dicey trading condition to continue with the decreasing process unabated.
Note: Cryptosignals.org is not a financial advisor. Do your research before investing your funds in any financial asset or presented product or event. We are not responsible for your investing results.
You can purchase Lucky Block here. Buy LBLOCK