Bitcoin (BTC/USD) Market Has Dumped, Averaging $27,000
Estimated Reading Time: 3 minutes
Don’t invest unless you’re prepared to lose all the money you invest. This is a high-risk investment and you are unlikely to be protected if something goes wrong. Take 2 minutes to learn more
Bitcoin Price Prediction – May 10
It observed that the BTC/USD market has dumped to average the $27,000 support line. The low-value line of $27,668.82 was traded back up to $27,684.00 during the last couple of hours, leaving $27,955.05 as the high point of the current trading session as the price’s percentage rate is at a minute negative of 0.16. The speed of the drop may eventually run out, perhaps near the $27,000 support level.
BTC/USD Market
Key Levels:
Resistance levels: $29,000, $30,000, $31,000
Support levels: $27,000, $26,000, $25,000
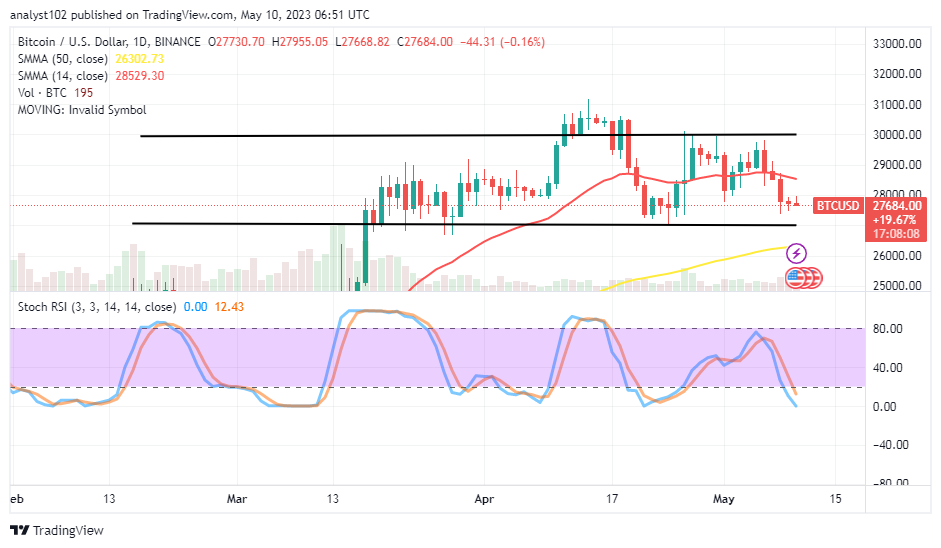
BTC/USD – Daily Chart
The BTC/USD daily chart reveals the crypto-economic market has dumped to average the $27,000 support level believed to serve as the lower range trading zone. The 50-day SMA indicator is at $26,302.73, serving as the critical underlying support against any further possible declines beneath the $28,529.30 point of the 14-day SMA indicator. The Stochastic Oscillators are in the oversold region, slightly pointing to the downside at 12.43 and 0.00 levels.
What may have happened if the Bitcoin/US Dollar continues to decline beyond $27,000?
Further declining pushes could occur in the BTC/USD trade operation against the $27,000 lower range line if bulls tend to lessen their presence, as it reported that the crypto market has dumped to average the value line. Around that point, the crypto economy may find a way of putting up with an effort to oppose a free fall-off moment for a while. The trend could change to a resumption of a bullish trend by having a trading candlestick surging northward.
On the downside of the BTC/USD technical analysis, sellers have to hold positions intensely in a consolidation-moving manner to affirm their presence beyond the psychological support trading line at $27,000. However, shorting positions under such a feeling require aggressive price movement.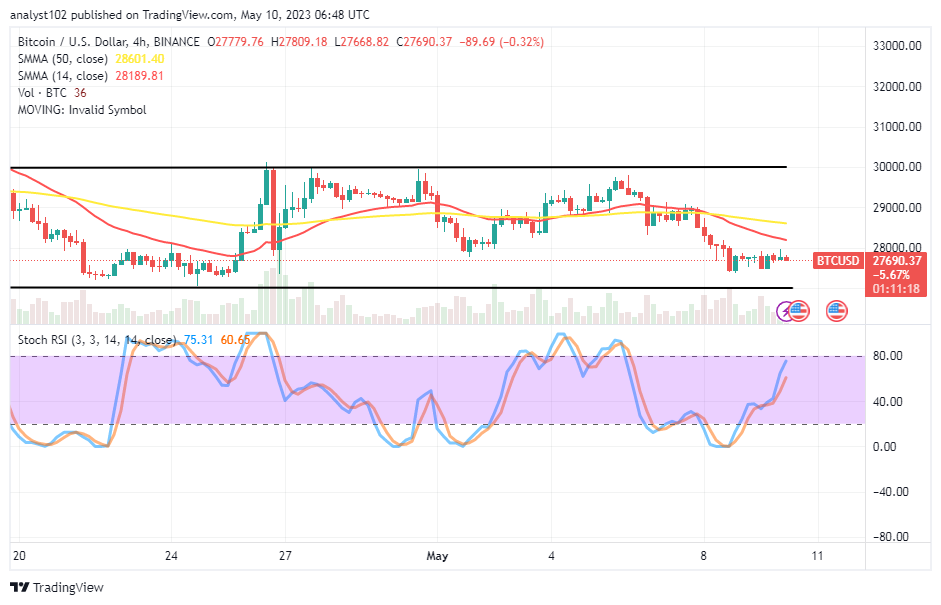
BTC/USD 4-hour Chart
The BTC/USD medium-term chart shows the crypto-economic market has dumped, averaging the $27,000 support level considered as the lower range line. The 50-day SMA indicator’s $28,601.40 is below the 14-day SMA indicator’s $28,189.81. The Stochastic Oscillators have managed to swing northbound from the oversold region to 60.65 and 75.31 levels. A line of smaller candlesticks has surfaced to denote that the last nine 4-hour candlesticks signify that a ranging movement is ongoing below the $28,000
.
Note: Cryptosignals.org is not a financial advisor. Do your research before investing your funds in any financial asset or presented product or event. We are not responsible for your investing results.
You can purchase Lucky Block here. Buy LBLOCK


