Bitcoin Price Prediction: BTC/USD Warming Up For the Next Jump; Price Touches $30,838 High
Estimated Reading Time: 2 minutes
Don’t invest unless you’re prepared to lose all the money you invest. This is a high-risk investment and you are unlikely to be protected if something goes wrong. Take 2 minutes to learn more
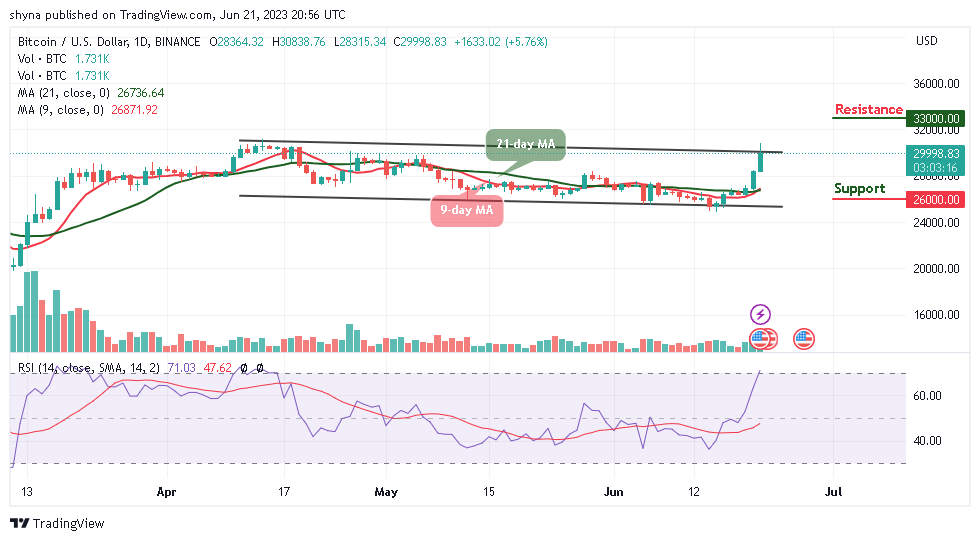
Bitcoin Price Prediction – June 21
The Bitcoin price prediction shows that BTC is seeing a glimpse of hope today with a decent 5.76% price increase climbing above $30,000.
BTC/USD Long-term Trend: Ranging (Daily Chart)
Key levels:
Resistance Levels: $33,000, $35,000, $37,000
Support Levels: $26,000, $24,000, $22,000
Looking at the daily chart, BTC/USD is bracing for a jump to the resistance level of $31,000 but as it is now; the coin is seen moving to cross above the upper boundary of the channel. Whether BTC/USD is going up or down depends on this range as the technical indicator Relative Strength Index (14) moves to cross above the channel.
Bitcoin Price Prediction: BTC Price May Create Additional Gains Above $31k Level
According to the daily chart, if the Bitcoin price can close above the current price of $29,998, a movement to $33,000, $35,000, and $37,000 resistance levels may likely come into focus. In other words, if the daily price closes below $28,000, the coin might drop slightly crossing down below the 9-day moving average while the red line of the 9-day MA may serve as critical support for the coin but a break below this may lead to a further supports at $26,000, $24,000, and $22,000 respectively.
BTC/USD Medium-term Trend: Bullish (4H Chart)
Looking at the 4-hour chart, the price of Bitcoin is currently moving around $30,074 and above the 9-day and 21-day moving averages. Meanwhile, the chart reveals that the bullish supply is coming up slowly in the market while the bears are also trying to drag the price down.
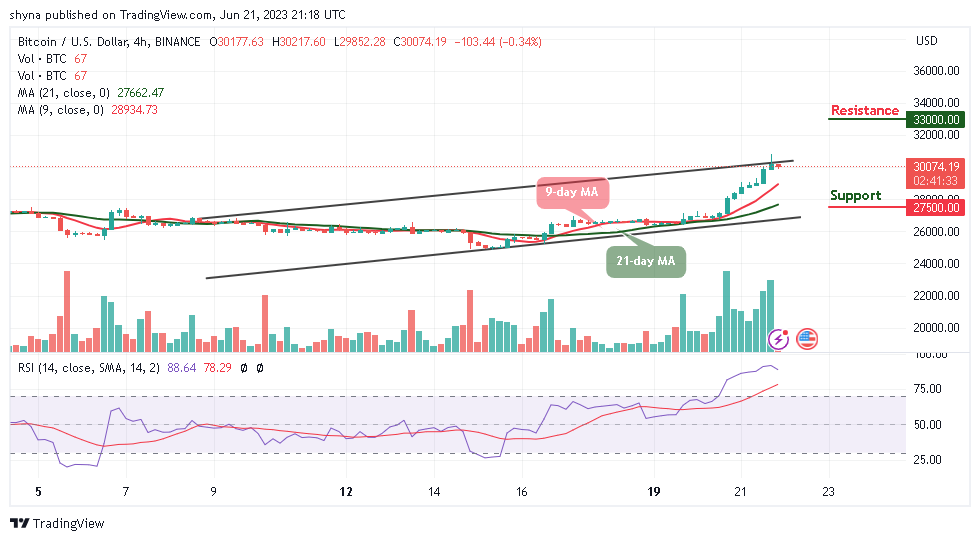
However, if the buyers could put more effort, they can further push the price to a $31,000 resistance level. Therefore, breaking the mentioned resistance could also test $33,000 and above. Moreover, the Relative Strength Index (14) is seen within the overbought region but could bring the price back to the support level of $27,500 and below.
You can purchase Bitcoin here. Buy BTC