Lucky Block Price Prediction: LBLOCK/USD Shows Weakness at $0.000098 Level
Estimated Reading Time: 3 minutes
Don’t invest unless you’re prepared to lose all the money you invest. This is a high-risk investment and you are unlikely to be protected if something goes wrong. Take 2 minutes to learn more
Lucky Block Price Prediction – September 11
The Lucky Block price prediction shows weakness at $0.000098, but this crucial technical formation could elevate it above $0.000100.
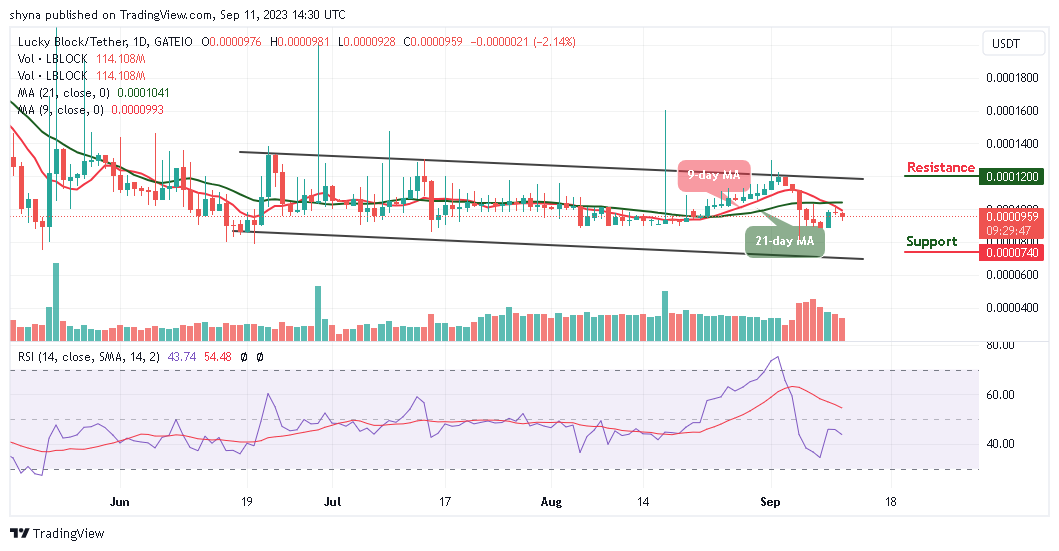
LBLOCK/USD Long-term Trend: Ranging (Daily Chart)
Key levels:
Resistance Levels: $0.000120, $0.000130, $0.000140
Support Levels: $0.000074, $0.000064, $0.000054
In the last couple of days, LBLOCK/USD keeps hovering under $0.000098. On the downside, immense support between $0.000095 and $0.000085 has ensured the bearish leg does not stretch further as the Lucky Block price has been pivotal at $0.000092 causing it not to be able to make progress above this critical level. Meanwhile, Lucky Block (LBLOCK) has been working on a recovery mission by crossing above the 9-day moving average.
Lucky Block Price Prediction: Where Would Lucky Block Go Next?
The Lucky Block price is moving around the crucial level of $0.000095 which could function as the support zone in the event a reversal occurs. Meanwhile, on the upside, as the coin moves toward the north, little is in place to prevent correction targeting the key resistance of $0.000100 as the technical indicator Relative Strength Index (14) moves above the 40-level.
However, as the daily chart reveals, LBLOCK/USD is banking on the support at $0.000092 and $0.000082 to ensure that despite a reversal, the Lucky Block price stays above the $0.000095 level. Moreover, if the coin crosses above the 9-day and 21-day moving averages, it will hit the resistance levels at $0.000120, $0.000130, and $0.000140 while sliding toward the lower boundary of the channel could locate the supports at $0.000074, $0.000064, and $0.000054 respectively.
LBLOCK/USD Medium-term Trend: Bearish (4H Chart)
The 4-hour chart shows that the Lucky Block price will soon find its way upward as the Relative Strength Index (14) keeps moving around the 50-level. Although, the bears have dominated the market for some time now; it is high time for the bulls to defend the $0.000090 support and push the price toward the north.
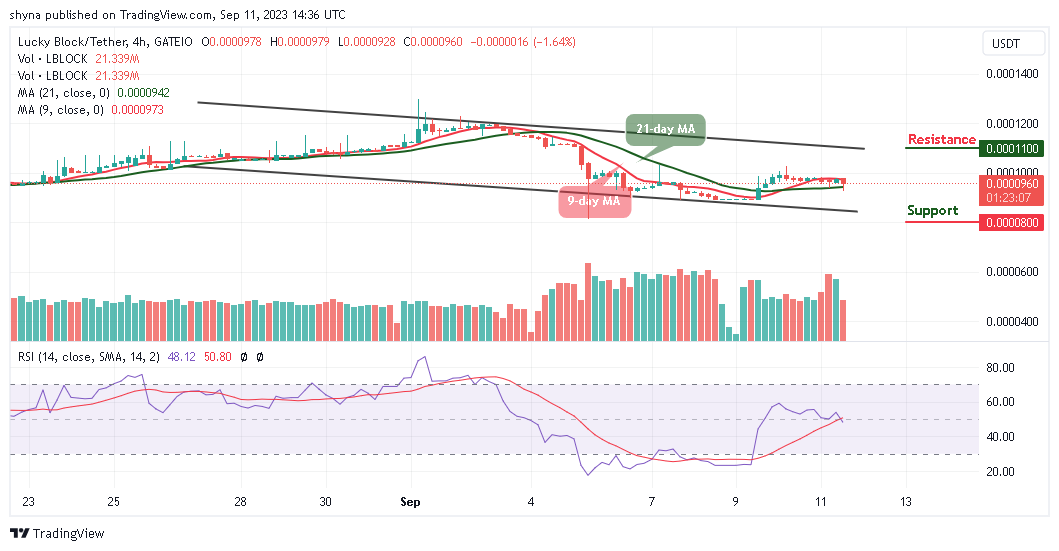
Meanwhile, the support level of $0.000080 and below may come into play if the price breaks below the 21-day moving average within the descending channel. But in as much as the red line of the 9-day MA remains above the green-line 21-day MA; the market could follow the upward trend but if the technical indicator crosses above the 60-level, it could touch the resistance level of $0.000110 and above.
You can purchase Lucky Block here. Buy LBLOCK