Biconomy (BICO/USD) Surges Towards the $0.300 Price Mark
Estimated Reading Time: 3 minutes
Don’t invest unless you’re prepared to lose all the money you invest. This is a high-risk investment and you are unlikely to be protected if something goes wrong. Take 2 minutes to learn more
In our most recent analysis of the Biconomy market, we observed the emergence of a descending wedge triangle pattern. This candlestick formation pattern is suggestive of a potential bullish reversal signal. As previously discussed in our analysis, this formation indicates waning bearish momentum. Despite the stability of the support level, it implies the likelihood of an imminent bullish breakout.
Biconomy Market Data
- BICO/USD Price Now: $0.270
- BICO/USD Market Cap: $178,132,647
- BICO/USD Circulating Supply: 657,617,262 BICO
- BICO/USD Total Supply: 1,000,000,000 BICO
- BICO/USD CoinMarketCap Ranking: #137
Key Levels
- Resistance: $0.300, $0.350, and $0.400.
- Support: $0.200, $0.150, and $0.100.
Price Prediction for Biconomy: The Indicators’ Point of View
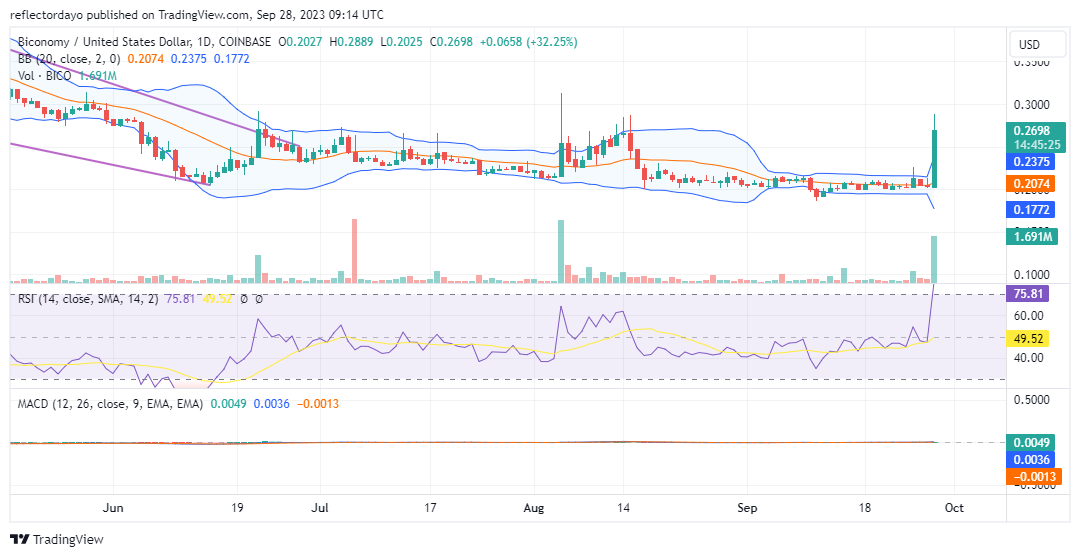
A bullish trend may have started in the Biconomy market, judging by the significant movement of the market in a bullish Upon analysis, it is evident that the market is experiencing a noteworthy shift in direction, accompanied by a substantial volume of trade histograms. The confluence of a robust bullish candlestick pattern and a strong histogram suggests that this recent market development is not merely a fleeting price fluctuation but rather a significant and meaningful event.
Nevertheless, as per the assessment of the Bollinger Bands indicator, there is an observed wild divergence in the bands, likely in response to the hyperbullish behavior of the market. This heightened market volatility may prompt increased activity, especially among traders seeking to capitalize on the considerable price surge by taking profits. It is worth noting that while a price retracement could become inevitable, the market is anticipated to discover and establish a higher support level, which could serve as a stabilizing factor in maintaining the prevailing bullish sentiment.
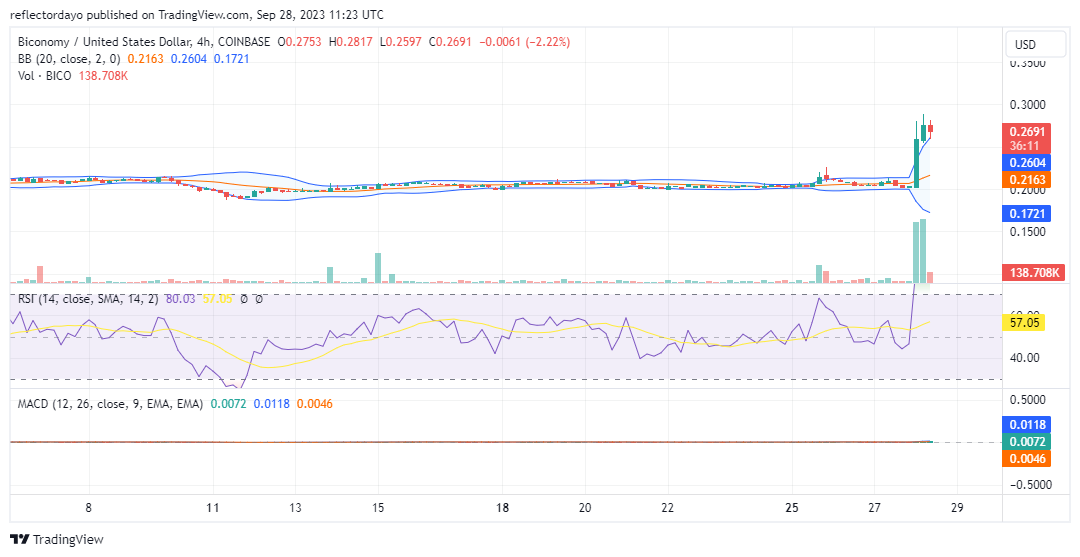
BICO/USD 4-Hour Chart Outlook
The notable bullish surge witnessed today, marked by a robust volume of trade histograms, has now given way to a diminutive histogram. This shift follows the fervent bullish momentum that has propelled the market into an overbought condition, as indicated by the Relative Strength Index (RSI). In light of this, traders should be prepared for a potential modest price retracement.
While a 32.6% price gain is indeed substantial, it should not be interpreted as an immediate signal that the rally has concluded. Such a formidable price movement has the potential to continue attracting new buyers, potentially leading to further gains over the short to medium term. However, it is prudent for investors to exercise caution and remain mindful of the possibility of retracements or corrections in the market.