Biconomy (BICO/USD) May Be Ending the Downtrend at $0.200
Estimated Reading Time: 3 minutes
Don’t invest unless you’re prepared to lose all the money you invest. This is a high-risk investment and you are unlikely to be protected if something goes wrong. Take 2 minutes to learn more
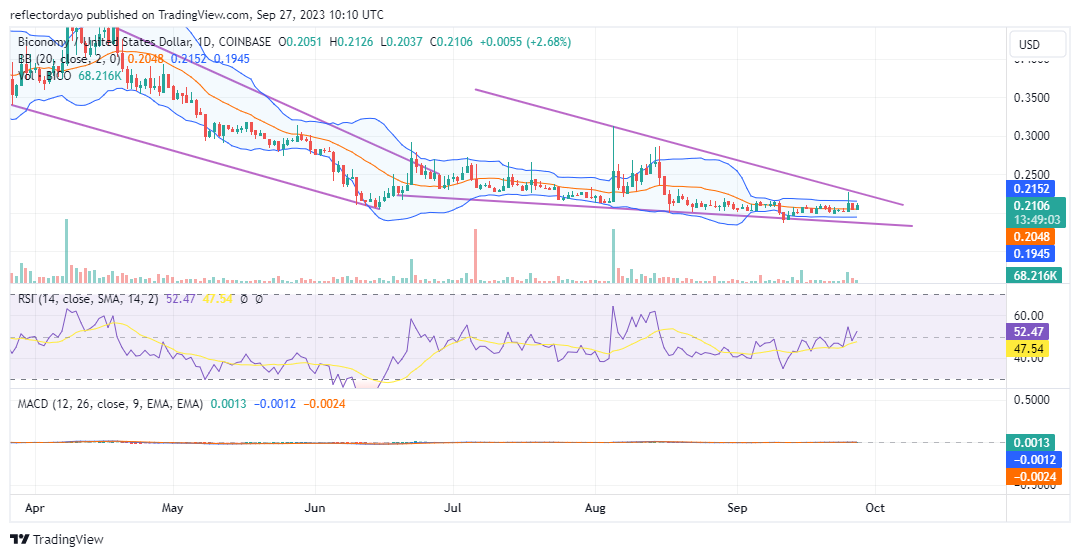
The Biconomy market remained in a substantial bearish trend until mid-June, at which point it experienced a notable uptrend following its interaction with the $0.200 price threshold. Nonetheless, despite the onset of bullish market sentiment, the price encountered resistance in surpassing the $0.300 price level, resulting in a retracement to the $0.200 support level. Since the latter half of August, this support level has effectively withstood all bearish pressures.
Biconomy Market Data
- BICO/USD Price Now: $0.200
- BICO/USD Market Cap: $139,334,665
- BICO/USD Circulating Supply: 657,617,262 BICO
- BICO/USD Total Supply: Data not provided
- BICO/USD CoinMarketCap Ranking: #167
Key Levels
- Resistance: $0.300, $0.350, and $0.400.
- Support: $0.200, $0.150, and $0.100.
Price Prediction for Biconomy: The Indicators’ Point of View
Analyzing the Biconomy market’s performance since reaching a peak of $0.55 in February reveals a persistent downtrend channel. However, a notable shift occurred when the market touched the $0.200 mark in mid-June, ushering in a descending wedge triangle pattern. This pattern carries substantial implications for a potential reversal, signifying the waning strength of the bearish trend and the potential for bullish momentum to take hold.
Presently, an intriguing development is the divergence observed in the Bollinger Bands, resulting in a tight price channel—a telltale sign of impending volatility. This suggests an impending, significant price movement. Further fueling optimism for an imminent bullish breakout is yesterday’s market testing of prices above the immediate resistance level. These factors collectively contribute to the unique dynamics of the current market landscape.
 BICO/USD 4-Hour Chart Outlook
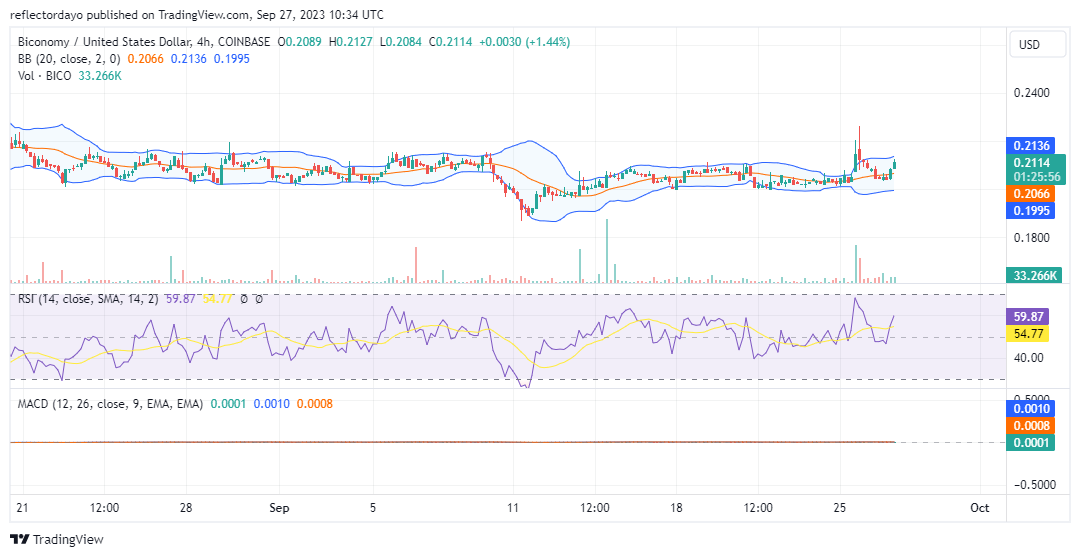 BICO/USD 4-Hour Chart Outlook
Examining the 4-hour chart perspective of the market, there is a discernible shift in price action direction, with the Bollinger Bands indicating the emergence of an ascending price channel. In the most recent daily session, the market not only tested but successfully exceeded the $0.22 price threshold, solidifying a marginally higher support level at $0.204. This shift signifies a diminishing bearish influence, concomitant with an accelerating bullish momentum, prompting consideration for a long trade position. However, it’s prudent to acknowledge the potential for resistance at the $0.22 price level in the impending bull market scenario.