Quant Price Prediction: QNT/USD Swings Above $150 Resistance
Estimated Reading Time: 3 minutes
Don’t invest unless you’re prepared to lose all the money you invest. This is a high-risk investment and you are unlikely to be protected if something goes wrong. Take 2 minutes to learn more
Quant Price Prediction – January 27
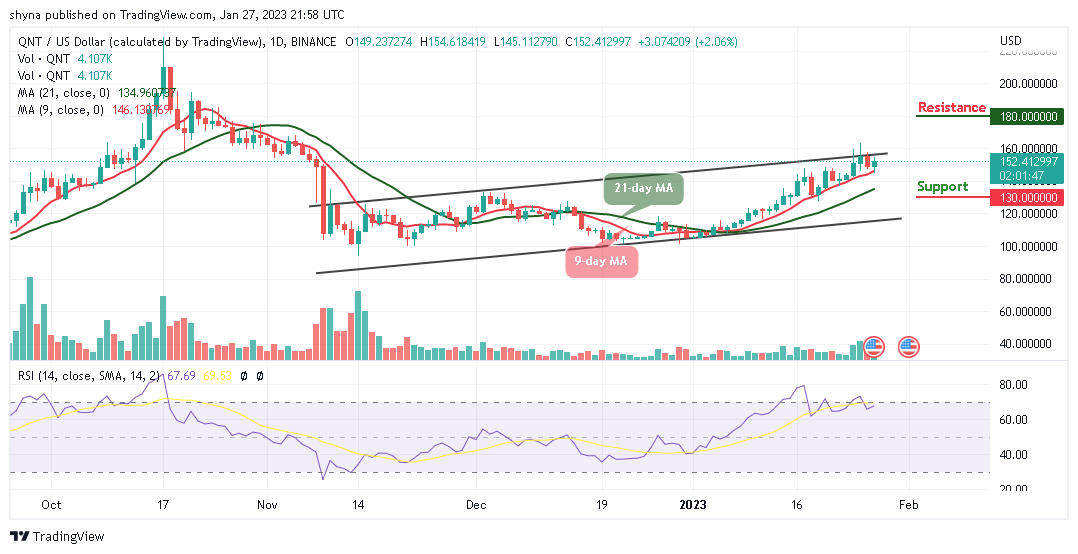
The Quant price prediction shows that QNT may restart the uptrend after touching the daily high of $154.61.
QNT/USD Long-term Trend: Bullish (Daily Chart)
Key levels:
Resistance Levels: $180, $190, $200
Support Levels: $130, $120, $110
QNT/USD looks green today as the price hovers above the 9-day and 21-day moving averages. However, a bullish cross above the upper boundary of the channel may increase the Quant price to the resistance level of $160. Nevertheless, traders should note that a consistent price increase could bring more buyers into the market as bulls increase their positions.
Quant Price Prediction: Price May Initiate a Price Hike
According to the daily chart, after the Quant price touches the daily high of $154.6, the crypto is now looking forward to touching another resistance level of $155. Therefore, if the red line of the 9-day moving average remains above the green line of the 21-day moving average, this will keep the coin on the positive side.
In other words, bears may bring the market price back below the moving averages if the bulls fail to push it to the upside. Meanwhile, the technical indicator Relative Strength Index (14) is hovering above the 60-level which could take the king coin to the resistance levels of $180, $190, and $200 but if the market price retreats and move towards the lower boundary of the channel, it may bring the price to the supports at $130, $120, and $110.
QNT/USD Medium-term Trend: Bullish (4H Chart)
According to the 4-hour chart, the Quant price is exchanging hands within the 9-day and 21-day moving averages as the coin heads toward the lower boundary of the channel which could reach the support level of $140 and below.
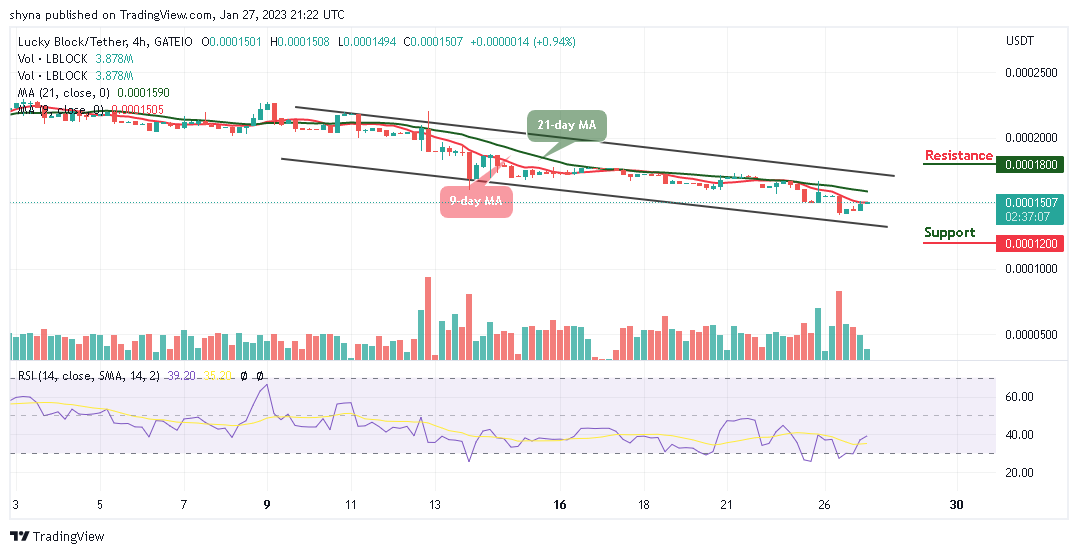
On the other hand, if the buyers push the market price upward, traders can expect a rise toward the upper boundary of the channel, and breaking this barrier could take the price to hit the resistance level of $165 and above. Meanwhile, the technical indicator Relative Strength Index (14) is moving below the 60-level, suggesting more bearish signals.
Place winning Quant trades with us. Get QNT here