Quant Price Prediction: QNT/USD Heads toward $160 Resistance
Estimated Reading Time: 3 minutes
Don’t invest unless you’re prepared to lose all the money you invest. This is a high-risk investment and you are unlikely to be protected if something goes wrong. Take 2 minutes to learn more
Quant Price Prediction – January 27
The Quant price prediction shows that QNT is heading toward the upside as the coin hovers around the $149.3 level.
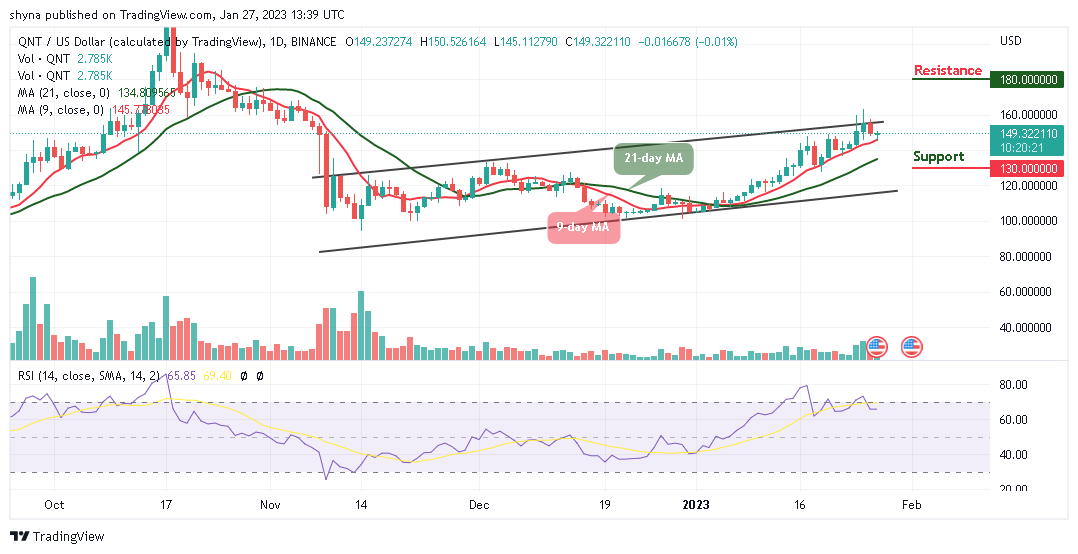
QNT/USD Long-term Trend: Ranging (1D Chart)
Key Levels:
Resistance levels: $180, $200, $220
Support levels: $130, $110, $90
QNT/USD is trading above the 9-day moving average as the coin moves to cross above the upper boundary of the channel. However, the coin could hit the $160 resistance level if the bulls return to the market. Moreover, as the Quant price trades at $149.32, it could probably test the support at $149 before heading to the upside.
Quant Price Prediction: QNT Price Could Move Sideways
According to the daily chart, the Quant price is hovering above the 9-day and 21-day moving averages. Therefore, a break above the upper boundary of the channel could encourage more buyers into the market, and this could push the price toward the resistance levels of $180, $200, and $220. On the downside, if the price breaks below the 9-day and 21-day moving averages, it could face the lower boundary of the channel, and sellers could gain traction with the next focus toward the nearest support at $135.
Therefore, if the support level of $135 is broken, the downside pressure will increase while the next supports can be created around $130, $110, and $90 respectively. The technical indicator Relative Strength Index (14) is likely to remain above the 60-level, as the signal line moves in that direction.
QNT/USD Medium-term Trend: Bullish (4H Chart)
According to the 4-hour chart, the Quant price is likely to cross above the 9-day and 21-day moving averages but it could move sideways before heading to the upside. However, a close above the resistance level of $150 will encourage the bulls to extend the rally toward the resistance level of $160 and above.
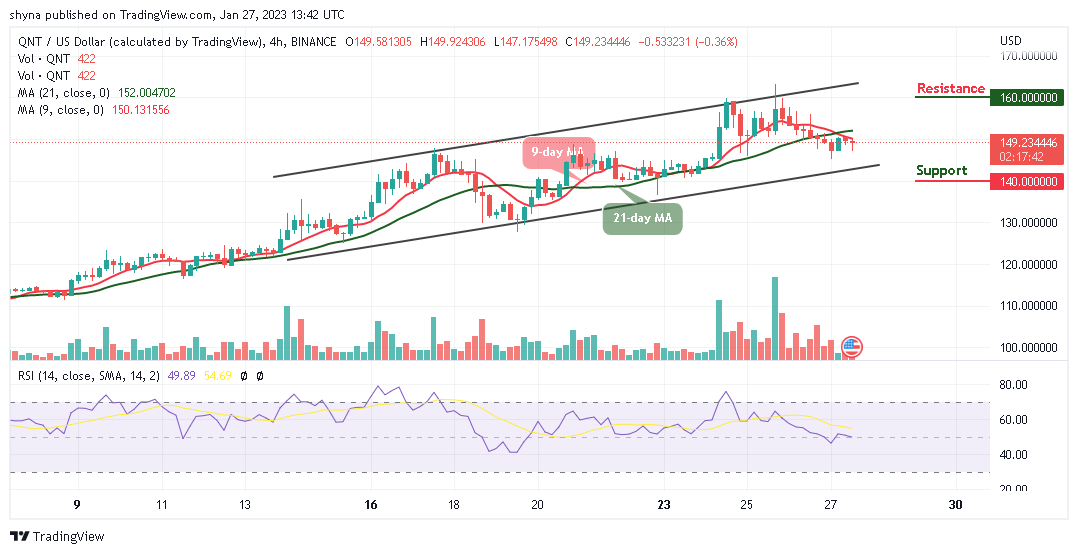
On the contrary, any bearish drop below the lower boundary of the channel could reverse the price of Quant, and a further bearish movement can locate the support level of $140 and below as the technical indicator Relative Strength Index (14) moves around the 50-level.
Place winning Quant trades with us. Get QNT here