Lucky Block Price Prediction: LBLOCK/USD Retreats to Recover Above $0.000100
Estimated Reading Time: 3 minutes
Don’t invest unless you’re prepared to lose all the money you invest. This is a high-risk investment and you are unlikely to be protected if something goes wrong. Take 2 minutes to learn more
Lucky Block Price Prediction – September 8
The Lucky Block price prediction reveals that LBLOCK slides below the opening price of $0.000 92 as further downsides could play out.
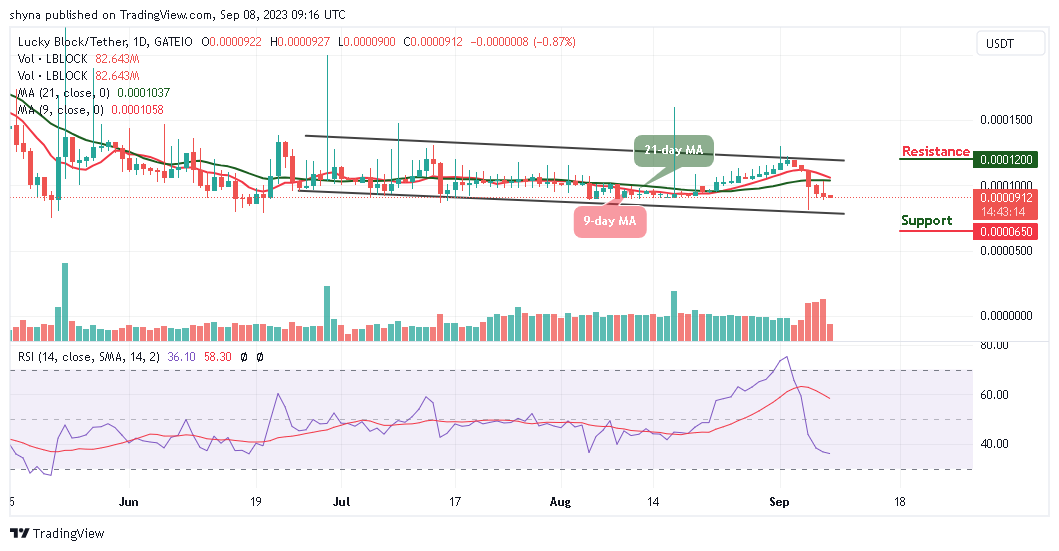
LBLOCK/USD Long-term Trend: Ranging (Daily Chart)
Key levels:
Resistance Levels: $0.000120, $0.000130, $0.000140
Support Levels: $0.000065, $0.000055, $0.000045
LBLOCK/USD is currently trading below the 9-day and 21-day moving averages as the coin hit the support level of $0000090. However, the Lucky Block price is hovering at $0.000091 after touching the resistance level of $0.000092. In the meantime, where Lucky Block will go next after this retreat is likely to depend on the ability of the bulls to hold the price above the key support at $0.000091.
Lucky Block Price Prediction: LBLOCK Could Face the Uptrend
The Lucky Block price remains intact within the channel but is yet to cross above the 9-day and 21-day moving averages. However, a further retracement seems imminent, and it is likely to break above the previous resistance at $0.000092. On the contrary, the $0.000065, $0.000055, and $0.000045 serve as the major supports just in case LBLOCK falls further. The technical indicator Relative Strength Index (14) is still moving below the 40-level, suggesting a sideways movement within the market.
Nevertheless, as the daily chart reveals, if the bulls could push the price back above the daily high at $0.000092, LBLOCK/USD may see a cross above the moving averages which could hit the potential resistance level at $0.000110, any further movement could send it to other resistance levels at $0.000120, $0.000130, and $0.000140 respectively.
LBLOCK/USD Medium-Term Trend: Ranging (4H Chart)
Looking at the 4-hour chart, the bulls are coming back into the market as the coin moves to cross above the 9-day and 21-day moving averages. Meanwhile, if the Lucky Block price breaks toward the upper boundary of the channel, the $0.000110 and above may come into play.
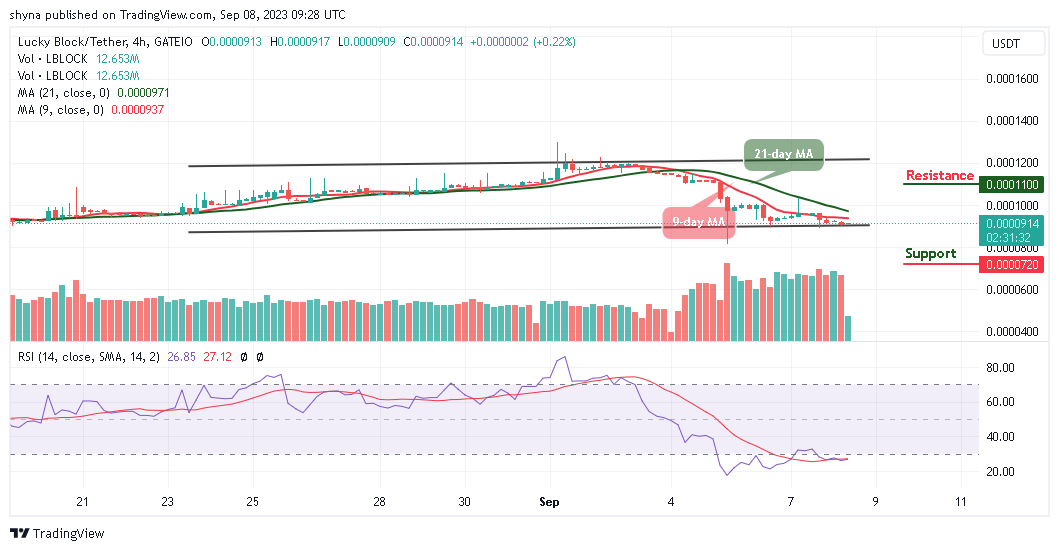
However, if the price breaks below the lower boundary of the channel and falls more, the support level of $0.000072 and below may be in focus. Meanwhile, as the technical indicator, the Relative Strength Index (14) moves within the oversold region, the coin may continue the sideways movement as this could be the best time for the existing and the new buyers to invest in the coin.
You can purchase Lucky Block here. Buy LBLOCK