BNB (BNB/USDT) Clings to the $900 Psychological Zone; What’s Next?
Estimated Reading Time: 3 minutes
Don’t invest unless you’re prepared to lose all the money you invest. This is a high-risk investment and you are unlikely to be protected if something goes wrong. Take 2 minutes to learn more
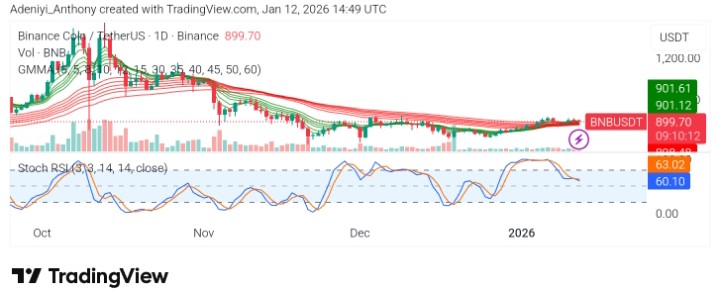
The market for BNB against Tether has fallen by 1.19% in the last 24 hours. It now operates around the $900 psychological level. Macro caution about January inflation data and mixed signals from the Fermi upgrade seem to dictate a breakout above $921 or a further continuation in the current condition. The price records choppy movement.
Currently, BNB trades at $899.70 with more than 133,000 volumes on the daily timeframe.
Technical Indicators
Major Resistance Levels: $910, $930, and $950
Major Support Levels: $899, $869, and $885
Technical Analysis
Technically, BNB against Tether on the daily timeframe remains under the domination of a bearish structure, as the sets of EMAs still display a bearish setup. However, in the meantime, it appears the long-period EMAs seem to be flattening, indicating weakness to the downside momentum as the price is seen clinging to the $899 line.
Beneath the chart, the Stochastic RSI appears to be cooling off from the overbought region, moving sideways as the momentum indicator displays consolidation rather than aggressive price movement.
To this end, it looks like the price is set for an either-side breakout, and a close above $910 or below $890 would dictate the direction of the market.
Everyone wants pump, but this is not the right way of bull run$BNB making a beautiful trendline base liq and rn in consolidation, expect a one quick rally for target
One wyck and we are gud to go, time fr quick gains iykyk pic.twitter.com/eeqJpgsmzG
— Elja 🦍 (@Eljaboom) January 9, 2026
Recently, @Eljaboom has posted that BNB is making a beautiful trendline, and many are expecting a pump. Meanwhile, the analyst is reiterating the need to have the right perspective on the bullish run, suggesting consolidation within a large space before a rally.
BNB/USDT Analysis: Short-term Exhaustion Emerges; Will Price Rise Again?
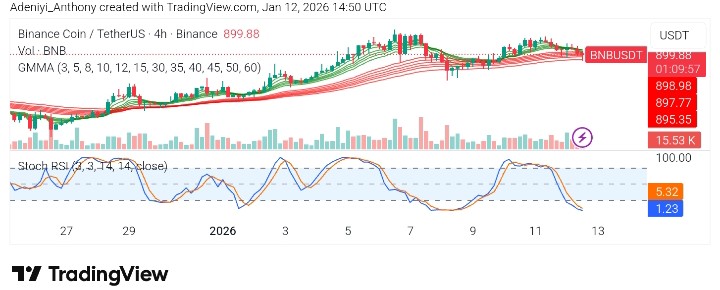
The 4-hour chart shows BNB/USDT retreating within an upward trendline structure. This indicates the pair, though experiencing a pullback, is going through a period of moderate profit-taking and panic selling.
In the meanwhile, the GMMA on this timeline appears to be relatively optimistic, indicating that the overall short-term trend remains positive.
From the other end, the Stochastic RSI has dropped sharply, displaying a slight curvature into the oversold region. This indicates a short-term probability of a comeback in the future session as bearish momentum weakens.
Meanwhile, as long as BNB/USDT holds above $895-$898, consolidation or a bounce remains a high possibility, but a break below $890 would signal a continued downtrend.
You can purchase crypto coins here. Buy Crypto


