Arbitrum Price Prediction: ARB/USD Consolidates Near $1.200; Price Will Climb Higher
Estimated Reading Time: 3 minutes
Don’t invest unless you’re prepared to lose all the money you invest. This is a high-risk investment and you are unlikely to be protected if something goes wrong. Take 2 minutes to learn more
Arbitrum Price Prediction – May 17
After touching the daily high of $1.177, the Arbitrum price begins a downside correction which will move toward the resistance level of $1.200.
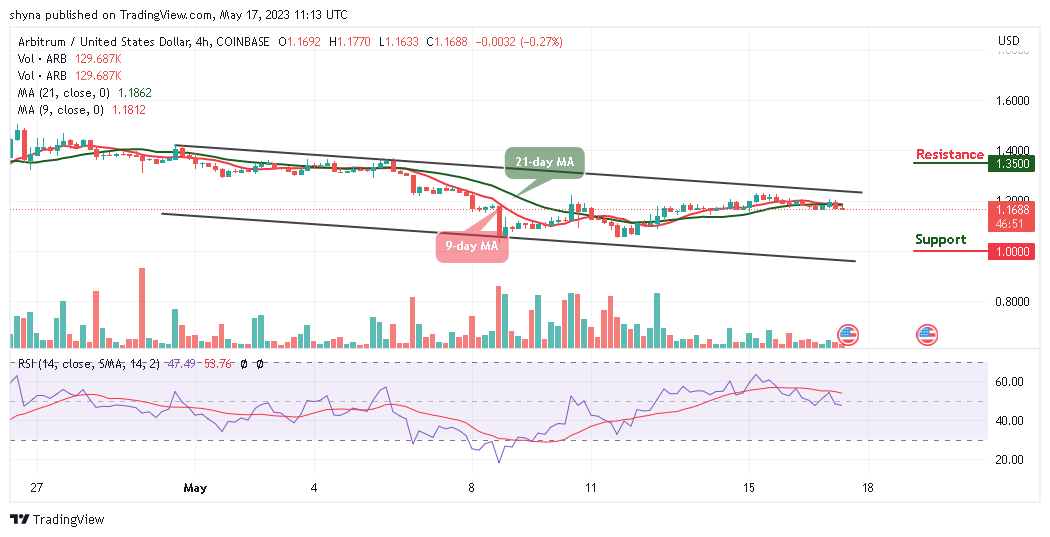
ARB/USD Medium-term Trend: Ranging (4H Chart)
Key levels:
Resistance Levels: $1.350, $1.370, $1.390
Support Levels: $1.000, $0.080, $0.060
Today, ARB/USD is seen slipping below the $1.169 level as buying pressure cooled off. The market price even traded below $1.165 and formed a low of nearly $1.160 before stabilizing. At the time of writing, ARB/USD is still trading below the 9-day and 21-day moving averages as it is down by 0.27% at its price of $1.168.
Arbitrum Price Prediction: What to Expect from Arbitrum (ARB)
The Arbitrum price is likely to test the lower levels in the next few hours but a decisive breakout below $1.150 support may intensify selling pressure. Therefore, if bears bring the market price toward the lower boundary of the channel, the consolidation may turn into a bear run. On the other hand, the sideways movement could also play out for the coin, and the next hurdle for the Arbitrum (ARB) could emerge at $1.300, but that won’t stop the higher price movements.
However, the bulls need massive liquidity and volume to cross the $1.200 level and make a dash to the $1.300 level. The technical indicator Relative Strength Index (14) is seen moving below the 50-level as any sharp downward slope could be an indication of the influence which may allow bears to increase the pressure.
Meanwhile, a reversal is possible but only if the resistance at $1.177 is reclaimed. The persistent trade above this level may technically push the coin to the resistance levels of $1.350, $1.370, and $1.390 while the supports lie at $1.000, $0.080, and $0.060.
ARB/USD Medium-Term Trend: Ranging (2H Chart)
Looking at the 2-Hour chart, Arbitrum (ARB) has not yet slipped below $1.150 and it is still in the loop of making a bounce back. The Arbitrum price hovers below the 9-day and 21-day moving averages and may likely take time to trade above the current market value at $1.162.
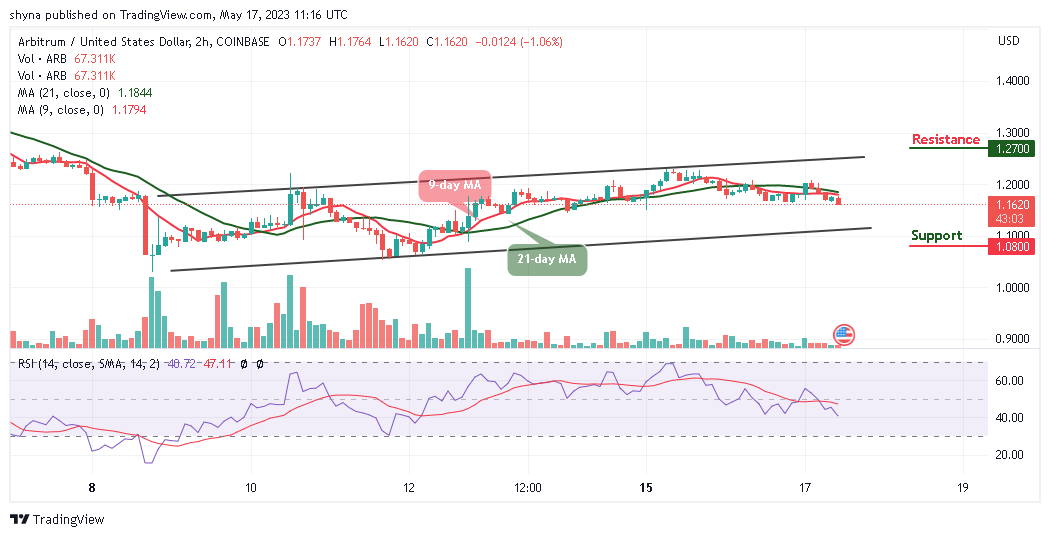
However, if the bulls energize the market, the price may likely test the resistance level of $1.270 and above. In other words, if the bears should continue to hold the price and drag it downward, then the support level of $95 and below could be visited as the Relative Strength Index (14) moves to cross below the 40-level, suggesting that bearish signals may come into play.
Place winning Arbitrum trades with us. Get ARB here