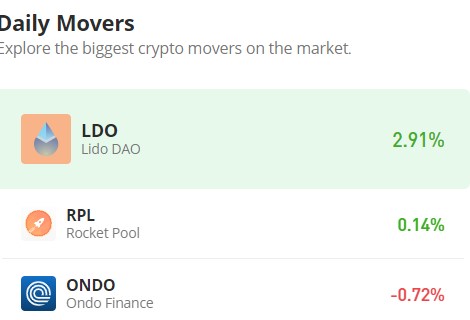
Rocket Pool (RPL/USD) Shifts Price Level Upward This Week; Market May Consolidate at $26
Estimated Reading Time: 2 minutes
Don’t invest unless you’re prepared to lose all the money you invest. This is a high-risk investment and you are unlikely to be protected if something goes wrong. Take 2 minutes to learn more
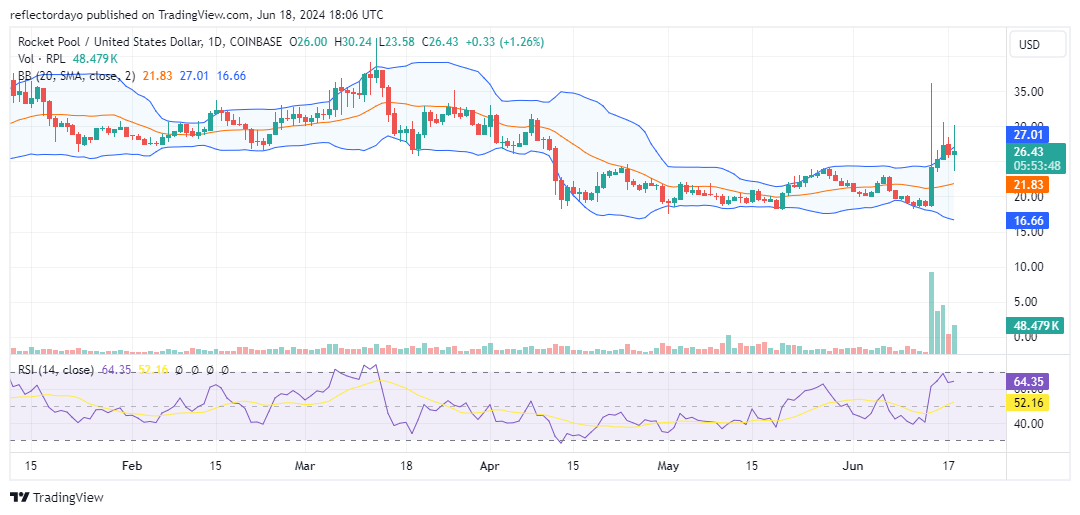
The Rocket Pool market experienced significant bullish momentum over the weekend, resulting in notable volatility. On Friday, June 14, the market saw a dramatic increase, with prices peaking at $36. However, profit-taking activities led to a subsequent downward correction. Despite this, the market continues to exhibit bullish tendencies, with strong support preventing prices from falling below the $26 level.
Rocket Pool Market Data
- RPL/USD Price Now: $26
- RPL/USD Market Cap: $538 million
- RPL/USD Circulating Supply: 20 million
- RPL/USD Total Supply: 20 million
- RPL/USD CoinMarketCap Ranking: #114

Key Levels
- Resistance: $27.50, $29.00, and $30.00
- Support: $22.00, $21.00, and $20.50.
The Rocket Pool Market Through the Lens of Indicators
The Bollinger Bands indicator has not yet shifted from a sideways ranging market to an upward-moving price channel; instead, the bands are diverging. This divergence results from the increased volatility caused by the strong bullish price movement over the last weekend. This crypto signal suggests that bears can also be formidable. Since June 16, the market has remained stable around $26, with today’s candlestick forming a long-legged doji. This candlestick pattern indicates strong market indecision, reflecting a standoff between demand and supply despite high volatility. Given the difficulty in breaking below the $26 level, a support level may be emerging. Additionally, the Rocket Pool market might be consolidating at this level, potentially establishing it as either a support or resistance.
RPL/USD Price Prediction: 4-Hour Chart Analysis
Examining the 4-hour market chart, we observe confirmation of a consolidation phase, with support and resistance converging around $26.50. The Bollinger Bands are also converging at this price level as volatility declines due to the stalemate between demand and supply. Further supporting this observation, the trading volume indicator shows histograms with decreasing heights. This volatility squeeze typically precedes a strong market movement.