The 1INCH Market (1INCH/USD) Bulls Eye $0.4 Support After Price Dip
Estimated Reading Time: 3 minutes
Don’t invest unless you’re prepared to lose all the money you invest. This is a high-risk investment and you are unlikely to be protected if something goes wrong. Take 2 minutes to learn more
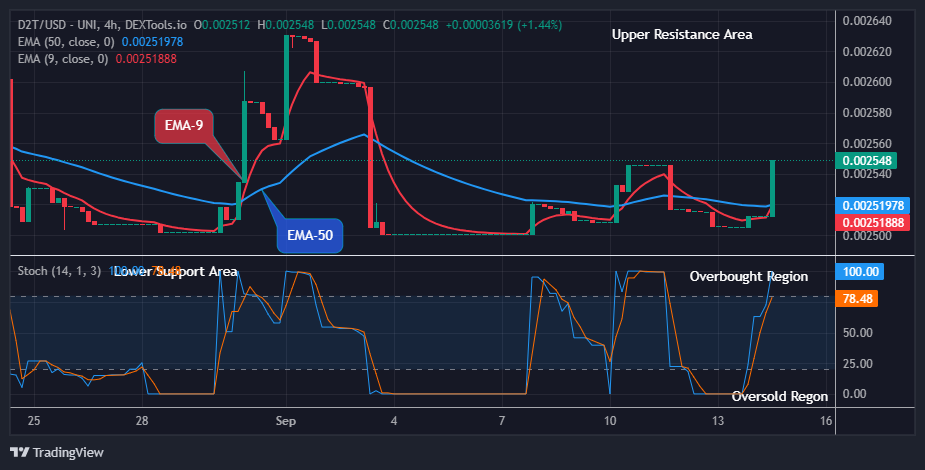
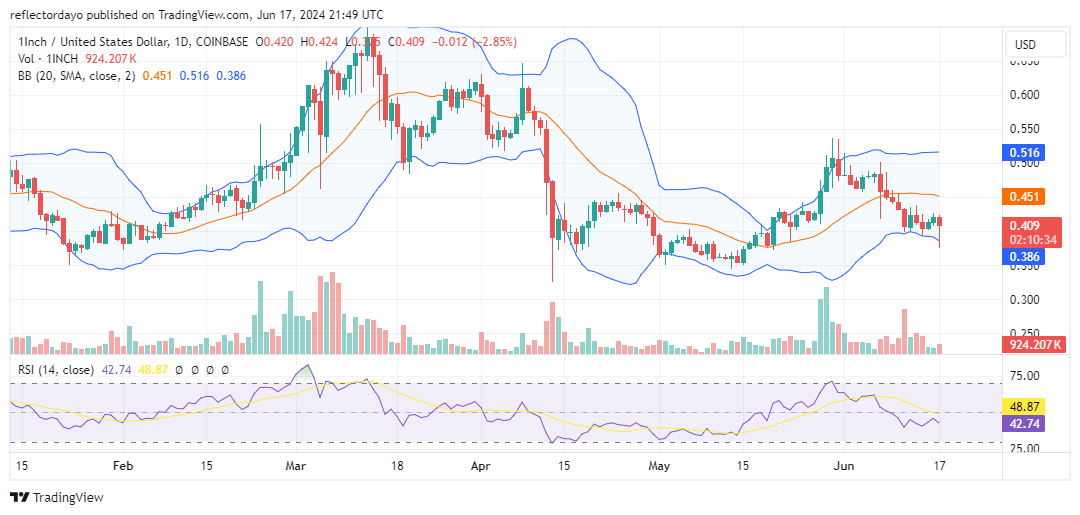
So far in June, the 1INCH market has been bearish after peaking at $0.54 at the end of May. On June 11, a support level emerged at $0.40. Bullish sentiment around this threshold caused the market to range sideways. As bulls balanced with bears, the market bandwidth initially converged into a narrow band. However, today’s price movement suggests heightened volatility, with bulls starting to capitalize on this opportunity.
The 1INCH Market Data
- 1INCH/USD Price Now: $0.409
- 1INCH/USD Market Cap: $513 million
- 1INCH/USD Circulating Supply: 1.3 billion
- 1INCH/USD Total Supply: 1.5 billion
- INCH/USD CoinMarketCap Ranking: #122
Key Levels
- Resistance: $0.45, $0.50, and $0.55
- Support: $0.40, $0.35, and $0.30.
The 1INCH Market Through the Lens of Indicators
The market has experienced high volatility since the end of last month. After encountering support at the $0.40 price level, it initially seemed that volatility would decrease as demand and supply reached a standoff near this threshold. However, today’s market movement initially saw a bearish trend, followed by a bullish response below $0.40, forming a hammer candlestick. This indicates that bulls are leveraging the current market volatility and rallying.
Indicators show the 1INCH market consolidation, with price action not breaking above the near resistance level of $0.419. Bulls have not yet established a bullish trajectory, as they have not surpassed this resistance. The Bollinger Bands, with substantial bandwidth, indicate the market is ranging sideways below the 20-day moving average. Additionally, the RSI line remains below the 50 level. The price action still appears to be in bearish territory, indicating that bulls need to do more to change the market direction.
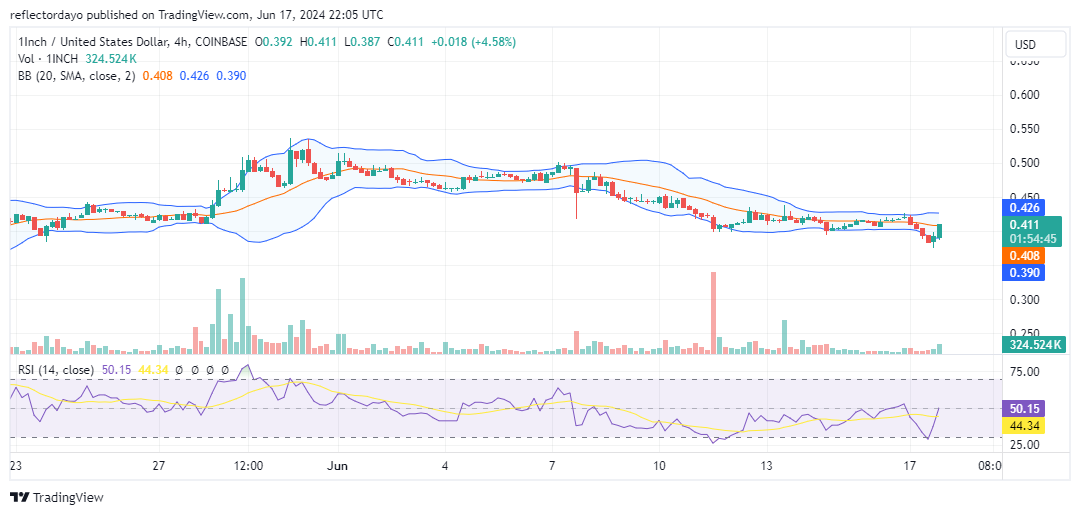
1INCH/USD Price Prediction: 4-Hour Chart Analysis
From this standpoint, the Bollinger Bands have narrowed due to the standoff between demand and supply. Earlier today, the bears showed strong bearish bias, but their aggression was short-lived. Bulls, on the other hand, demonstrated their willingness to buy around the $0.40 price level, causing a significant rally. The price action has now reached the 20-day moving average. It seems like (from this crypto signal) the consolidation will continue, with no indication that the market is ready for a clear directional movement yet.