SPONGE/USD Bulls Anticipate Convergence at the $0.00073 Mark
Estimated Reading Time: 3 minutes
Don’t invest unless you’re prepared to lose all the money you invest. This is a high-risk investment and you are unlikely to be protected if something goes wrong. Take 2 minutes to learn more
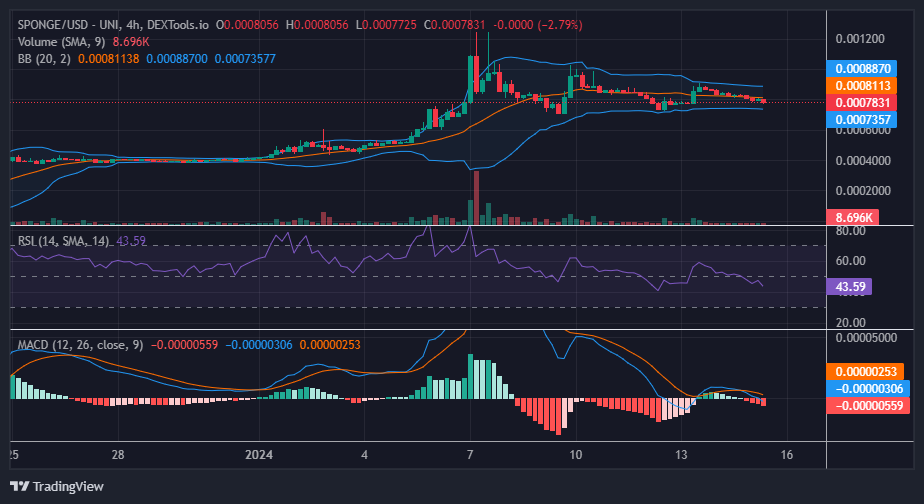
As bulls yielded to mounting bearish pressure at the $0.0008 price level, the likelihood increased for a price action bounce from the historical support established at the $0.00073 level on January 12. However, if $SPONGE bulls are compelled to reconverge at this threshold, it is anticipated to result in a sideways-ranging trend, given that it remains within a relatively narrow price range.
Key Market Indicators:
- Resistance Levels: $0.0010, $0.0011, and $0.0012.
- Support Levels: $0.000450, $0.00040, and $0.00035.
In-depth Technical Analysis for $SPONGE (SPONGE/USD):
The establishment of a bearish trend hinges on the bearish momentum successfully breaching the $0.00073 support level. However, this scenario appears less likely due to the relatively small histograms observed in the volume of trade indicator. The diminutive size of the histograms suggests a low volume of trade, indicating a reduced inclination among $SPONGE investors to sell in the market.
The Bollinger Bands indicator reinforces this perspective, revealing a tightening bandwidth in the market action as the price descends below the 20-day moving average. While the indicators imply a strengthening bearish momentum, the combination of a low trade volume suggests that the bears might encounter challenges in driving the market below the critical support level of $0.00073.
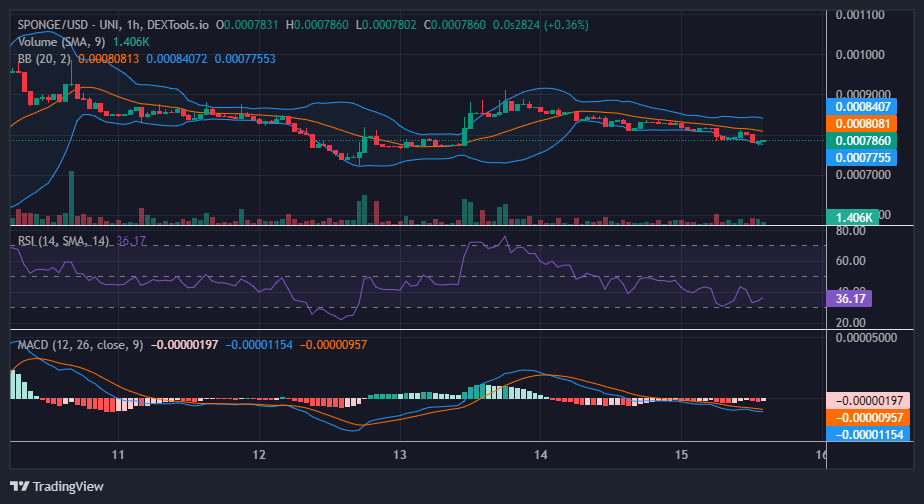
Insights from the 1-Hour Perspective:
To validate the prevailing market sentiment reflected in the 4-hour chart, an examination of the 1-hour chart already reveals the emergence of bullish momentum. Although currently resembling a doji, indicative of indecision, the formation signals bullish activity. This is evident in the rejection of bearish trends as the market approaches a pivotal support level.
However, within the context of the price action trend, the chart exhibits a downtrending price channel. This suggests a potential for further downward movement until the market reaches the historical crucial support level, at which point a price rally may become apparent.
We have now reached 5,010,192,318 $SPONGE tokens staked, which is equivalent to $3,998,276.67!
🎉 Huge Milestone Alert! 🎉
We’ve just surpassed an incredible 5,010,192,318 $SPONGE tokens staked, valued at $3,998,276.67!
With a current APY of over 300%, our community is thriving like never before.
Join us now and absorb the damp! 🧽💦#SpongeV2 #Crypto #Altcoins pic.twitter.com/KIVvh77dQZ
— $SPONGE (@spongeoneth) January 15, 2024
Invest in the hottest and best meme coin. Buy Sponge ($SPONGE) today!