SPONGE (SPONGE/USD) Consolidates at $0.00085, Preparing for More Bullish Action
Estimated Reading Time: 3 minutes
Don’t invest unless you’re prepared to lose all the money you invest. This is a high-risk investment and you are unlikely to be protected if something goes wrong. Take 2 minutes to learn more

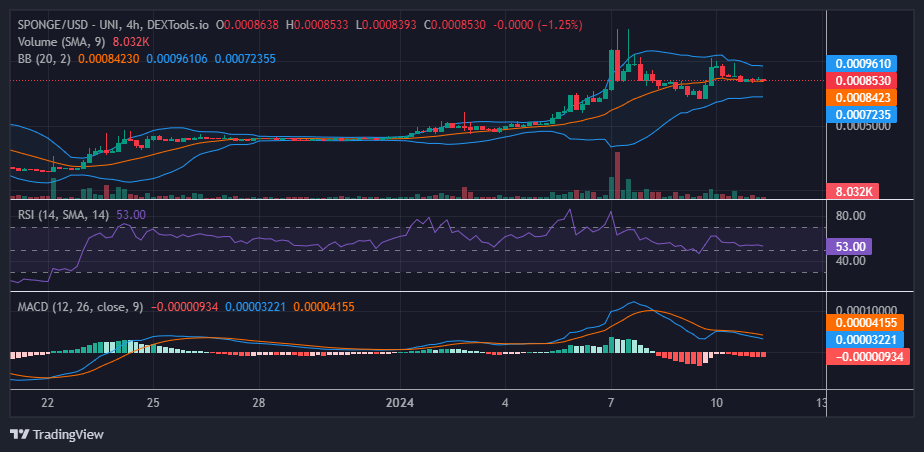
The $0.00085 price level is emerging as a noteworthy threshold in the SPONGE/USD market. Traders’ interest is increasing at this price level, and the prevalence of upward movements suggests that the market may continue its bullish trend. Should this momentum persist, the next target for the market appears to be the $0.0010 price level.
Key Market Indicators:
- Resistance Levels: $0.0010, $0.0011, and $0.0012.
- Support Levels: $0.000450, $0.00040, and $0.00035.
In-depth Technical Analysis for $SPONGE (SPONGE/USD):
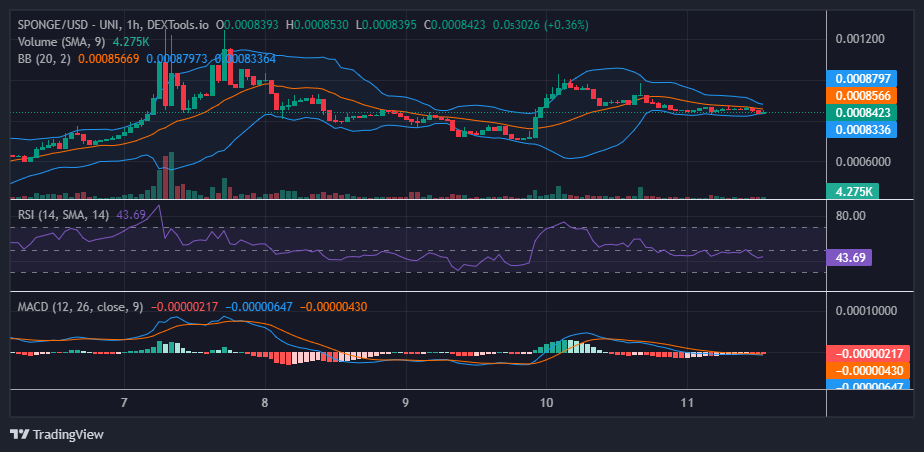
Examining the market through the lens of the Bollinger Bands indicator, both standard deviation curves are stabilizing around the 20-day moving average at the $0.00085 price level. Simultaneously, price action is converging near the $0.00085 level. A faceoff between demand and supply is currently causing a decline in trade volume. This decline may potentially lead to the SPONGE/USD market consolidation, establishing the level as a support level. Subsequently, the market could resume its bullish trajectory, with the $0.0010 price level as the target.
While the market appears to be in a state of equilibrium, the bulls maintain a slight advantage. This is evident as the price action remains above the midpoint of the indicators, placing it in the bullish zones.
Insights from the 1-Hour Perspective:
In the 1-hour chart analysis of the market, the price currently reflects a state of equilibrium. However, in this context, the bears hold a slight advantage. Presently, neither the bulls nor the bears have managed to establish a clear market direction due to the ongoing consolidation.
It is noteworthy that the Bollinger Bands indicator’s bands are converging, signaling an impending breakout. There is a possibility that this breakout might occur in an upside direction.
To get exclusive SpongeV2 benefits, purchase and bet $SPONGE right away!
🔓💰 Buy and stake $SPONGE now to unlock special #SpongeV2 bonuses!
Don’t miss this exclusive offer. Time is running out! ⏰ #MemeCoin #BullMarket #Web3 pic.twitter.com/QtSi01hSN7
— $SPONGE (@spongeoneth) January 11, 2024
Invest in the hottest and best meme coin. Buy Sponge ($SPONGE) today!