Dogecoin (DOGE/USD) Price Is Floating, Attempting to Make a Baseline
Estimated Reading Time: 3 minutes
Don’t invest unless you’re prepared to lose all the money you invest. This is a high-risk investment and you are unlikely to be protected if something goes wrong. Take 2 minutes to learn more
Dogecoin Price Prediction – January 29
More falling forces have been featured in the exchange lines between the Dogecoin market and the purchasing worth of the US coin, as it has been reported that the price is floating above the line of $9.970, attempting to make a baseline.
In order to conserve a structure that indicates good re-entry points for buyers to leverage forces to move upward for a retest of the prior lower trading zones, the trade environment has been somewhat recomposed. Given the realization of that premise, long-position takers should exercise caution in the event that they witness the market frantically plunging below the value of $0.070, frightened and battling the underlying supports.
DOGE/USD Market
Key Levels:
Resistance levels: $0.090, $0.10, $0.11
Support levels: $0.070, $0.065, $0.060
DOGE/USD – Daily Chart
The DOGE/USD daily reveals that the crypto-economic market is floating around the axis of the lower Bollinger Band, attempting to make a baseline.
The stochastic oscillators have been trying to get repositioned around the values of both 40 and 20 to point in the next possible direction that the price may tend to move in in the near future. The Bollinger Bands have been noticed to start movements, denoting that a series of sideways is in the offing.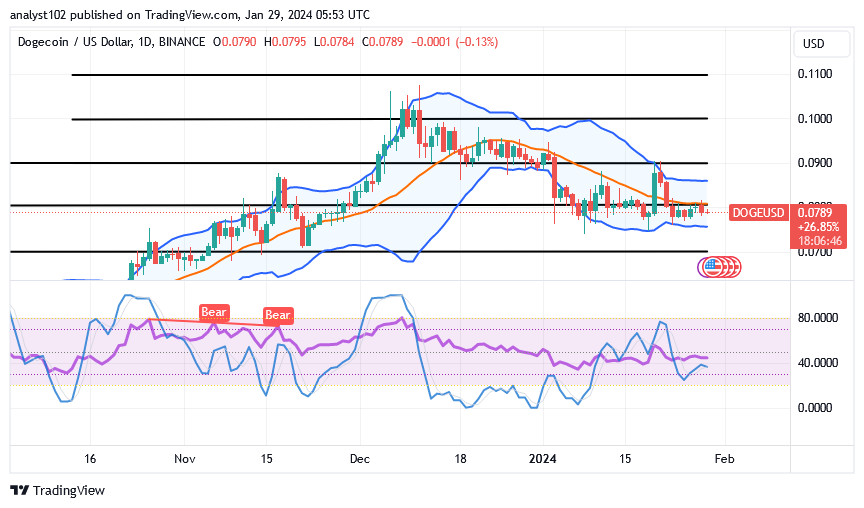
If there will be further price corrections in the DOGE/USD market at this moment, which point is expected to be the toughest resistance spot?
The most expected difficult trade resistance spot for bears to prolong their presence has been spotted around the point of $0.080, as the DOGE/USD market is floating, attempting to make a baseline.
Bulls can leverage their attempts to make solid and positive comebacks by taking advantage of different lines of bounces from multiple weak fall-offs, mainly around the lower Bollinger Band trend line. Investors may need to stick with their technique of investing their money under the guise of that supposition, hoping it will materialize, even though there will still be room for lows.
If there is an unexpected comeback in price, bears could be susceptible to being whipsawed. Around the lower Bollinger Band’s point, sellers would be taking a risk when entering new shorting entry orders. Consequently, we discourage the formation of new shorting positions in that zone, particularly if it continues to go further.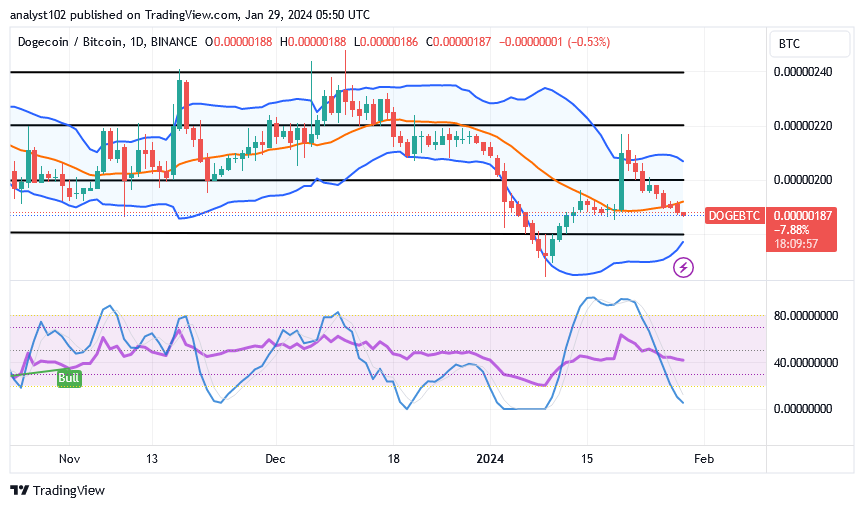
DOGE/BTC Price Analysis
In contrast, the Dogecoin trade is floating negatively above the line of the lower Bollinger Band against Bitcoin, seemingly attempting to make a baseline soon.
The stochastic oscillators have penetrated the blue part maximally into the oversold region to denote that the base crypto coin is on the verge of regaining stances. The lower Bollinger Band trend line may bottom out close to or around it, indicating that the pattern of falling candlesticks is about to come to a stop. The buying frenzy will pick up more respectably as soon as a bullish candlestick appears every day.
Note: Cryptosignals.org is not a financial advisor. Do your research before investing your funds in any financial asset or presented product or event. We are not responsible for your investing results.
You can purchase Lucky Block here. Buy LBLOCK