SPONGE/USD Support Proves Its Strength Amid Market Turbulence
Estimated Reading Time: 3 minutes
Don’t invest unless you’re prepared to lose all the money you invest. This is a high-risk investment and you are unlikely to be protected if something goes wrong. Take 2 minutes to learn more

The crucial support zone between $0.0000037 and $0.0000035 is once again being put to the test—and so far, SPONGE/USD is holding its ground. Despite a clear surge in market volatility, bulls have managed to prevent any sustained breakdowns, keeping price action securely above this key defensive region.
In today’s trading session, the crypto signal has remained stable around $0.0000036, with four consecutive doji candlesticks forming—a classic sign of indecision. This tight consolidation suggests that the market is building pressure and may soon be preparing for a significant breakout move.
Key Price Levels
- Resistance: $0.0000040, $0.0000045, $0.0000050
- Support: $0.0000030, $0.0000025, $0.0000020

SPONGE/USD Daily Chart
The daily chart reveals a compelling display of market resilience. Since early November, every bearish attempt to break below this key support level has been met with strong buying interest, as shown by the long lower wicks on the candlesticks. This consistent rejection suggests that although sellers continue to test the support, SPONGE/USD buyers are actively absorbing the downward pressure. The longer this support withstands repeated challenges, the more significant the eventual breakout or breakdown will be when the market finally commits to a decisive move.
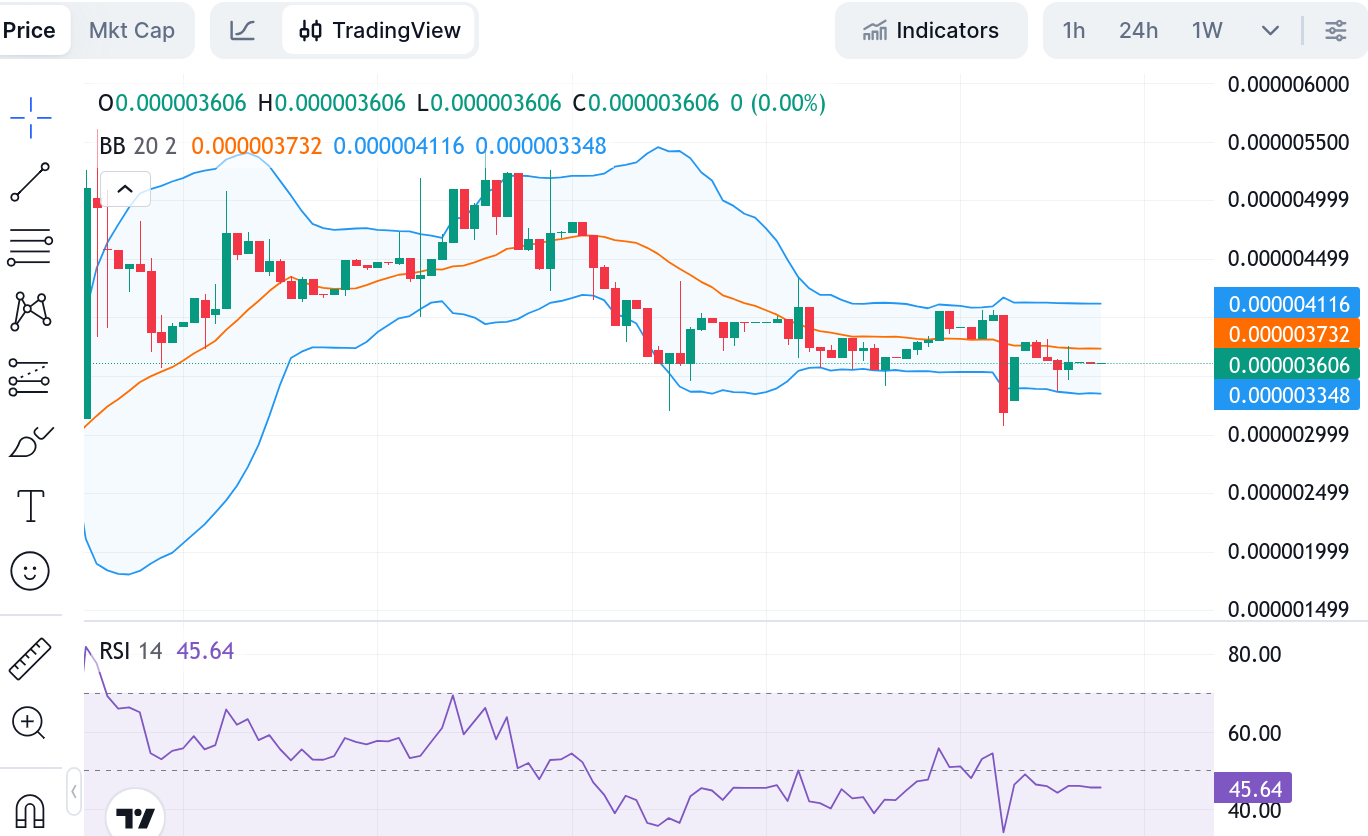
SPONGE/USD 4-Hour Chart
On the 4-hour chart, the market continues to move in a consolidation phase similar to what is observed on the daily timeframe. However, within this shorter time frame, the bears appear to have a slight advantage. The Relative Strength Index (RSI) sits just below the midpoint—around the 45 level—indicating weak bearish momentum rather than strong downward pressure.
Despite this, price action remains within a range still influenced by bullish support, suggesting that the market is not yet fully tilted in favor of the bears. The next decisive move will depend on whether buyers can reclaim momentum or if sellers strengthen their position in the coming sessions.
Buy $SPONGE!
Time to hunt some bears pic.twitter.com/TZA04OKnWH
— $SPONGE (@spongeoneth) November 19, 2025
Join the SPONGE community and get in on the next big crypto opportunity! Buy Sponge ($SPONGE) today