Lucky Block Price Prediction: LBLOCK/USD Becomes Cheaper; Best Time to Buy
Estimated Reading Time: 3 minutes
Don’t invest unless you’re prepared to lose all the money you invest. This is a high-risk investment and you are unlikely to be protected if something goes wrong. Take 2 minutes to learn more

Free Crypto Signals Channel
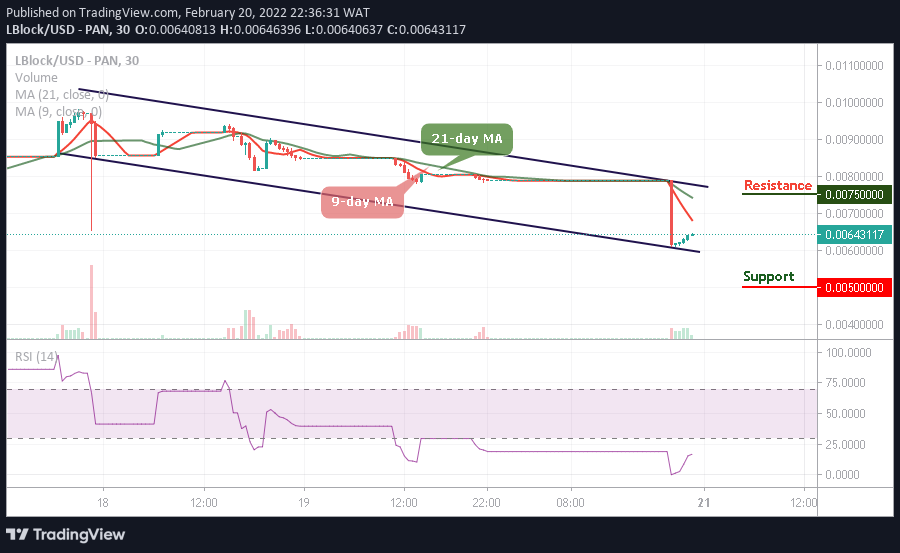
The Lucky Block price prediction begins to form higher after touching the low of $0.00610 as the bears lose grip over the coin.
LBLOCK/USD Medium-term Trend: Ranging (30 Minutes Chart)
Key Levels:
Resistance levels: $0.00750, $0.00800, $0.00850
Support levels: $0.00500, $0.00450, $0.00400
At the time of writing, LBLOCK/USD is beginning a fresh bullish movement as the market price prepares to cross above the 9-day moving average. Meanwhile, the bullish momentum would propel the coin to move above the resistance level of $0.00700 as the bullish pressure may break to the upside. However, should the bulls fail to push the price upward, the Lucky block price may consolidate for a while, allowing more buyers to re-enter the market.
Lucky Block Price Prediction: LBLOCK/USD Ready to Spike Higher
The Lucky Block price may continue to rise and break above the 9-day moving average if the bulls defend the $0.00650 support level. Therefore, any further bullish movement towards the upper boundary of the channel may push the price to the potential resistance levels of $0.00750, $0.00800, and $0.00850.
On the contrary, this technical analysis may be invalidated if the bears break below the lower boundary of the channel and fall to the low of $0.00500, $0.00450, and $0.00400 support levels. Moreover, the technical indicator Relative Strength Index (14) is moving away from the oversold region to continue to give the additional bullish movements.
LBLOCK/USD Medium-term Trend: Ranging (15 Minutes Chart)
Against Bitcoin, the Lucky Block price is moving above the 9-day moving average, and any further bullish movement may touch the resistance level of $0.00750 and above. Therefore, the 21-day moving average may keep the bullish movement as the market begins a new trend.

However, if the sellers bring the price below the lower boundary of the channel as the technical indicator Relative Strength Index (14) remains within the oversold region, the coin may become cheaper for the new investors to enter the market as the nearest support level may be located at $0.00520 and below.
Read more: