The Graph (GRT/USD) Bull Run Seems to Be Nearing its Peak
Estimated Reading Time: 3 minutes
Don’t invest unless you’re prepared to lose all the money you invest. This is a high-risk investment and you are unlikely to be protected if something goes wrong. Take 2 minutes to learn more
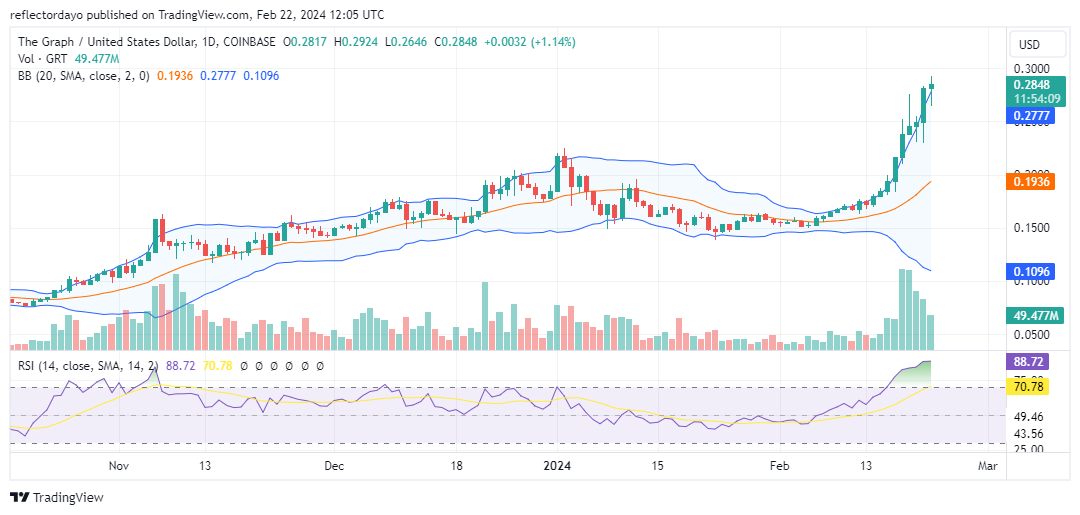
The Graph market initiated a bullish trend on February 6, following a period of stagnation where bullish and bearish forces were evenly matched. Subsequently, the bull market gained momentum consistently. Initially appearing one-sided, the bullish trend soon witnessed increased volatility as bullish momentum intensified, prompting a response from bearish forces. Although recent days have seen notable bearish activity, it has largely proved unsustainable, with bullish sentiment prevailing and rejecting the bearish pressure. However, current market conditions suggest that the overall trend may be approaching its peak.
The Graph Market Data
- GRT/USD Price Now: $0.284
- GRT/USD Market Cap: $2.6 billion
- GRT/USD Circulating Supply: 9.4 billion
- GRT/USD Total Supply: 10.8 billion
- GRT/USD CoinMarketCap Ranking: #41
Key Levels
- Resistance: $0.30, $0.35, and $0.40.
- Support: $0.25, $0.20, and $0.15.
The Graph Market Analysis: The Indicators’ Point of View
During the bullish phase, the Bollinger Bands began to diverge, indicating an increase in volatility attributed to growing liquidity in the market. This heightened volatility is reflected in the Relative Strength Index (RSI), which has entered the overbought zone due to the significant bullish sentiment. The Graph market has remained in the overbought zone for an extended period, further emphasizing the strength of the bullish momentum. In such instances, where a sudden surge in bullish activity coincides with the market entering the overbought zone on the RSI and the appearance of a spinning top or long-legged doji, these crypto signals may suggest an impending bearish price movement.
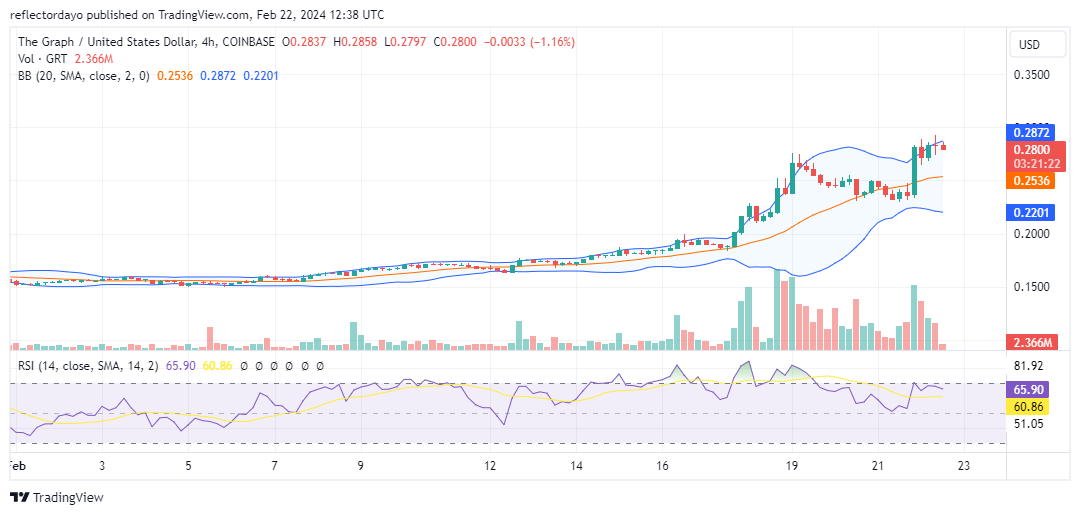
GRT/USD 4-Hour Chart Outlook
However, upon examining the market from the perspective of the 4-hour chart, it’s evident that following the robust (almost hyperbullish) performance during the last four-hour sessions of the previous day, a similarly strong bearish movement is anticipated. Nonetheless, the apparent formation of a support level at $0.27 introduces the possibility that bullish sentiment may persist, with bulls potentially defending against further downward pressure at this level. Furthermore, the anticipated bearish movement appears somewhat subdued, likely due to a standoff between bullish and bearish forces. Should the bearish trend breach this support level, a significant downward price movement is expected to ensue.