Orchid (OXT/USD) Is on the Trail of January 1’s high of $0.145
Estimated Reading Time: 2 minutes
Don’t invest unless you’re prepared to lose all the money you invest. This is a high-risk investment and you are unlikely to be protected if something goes wrong. Take 2 minutes to learn more
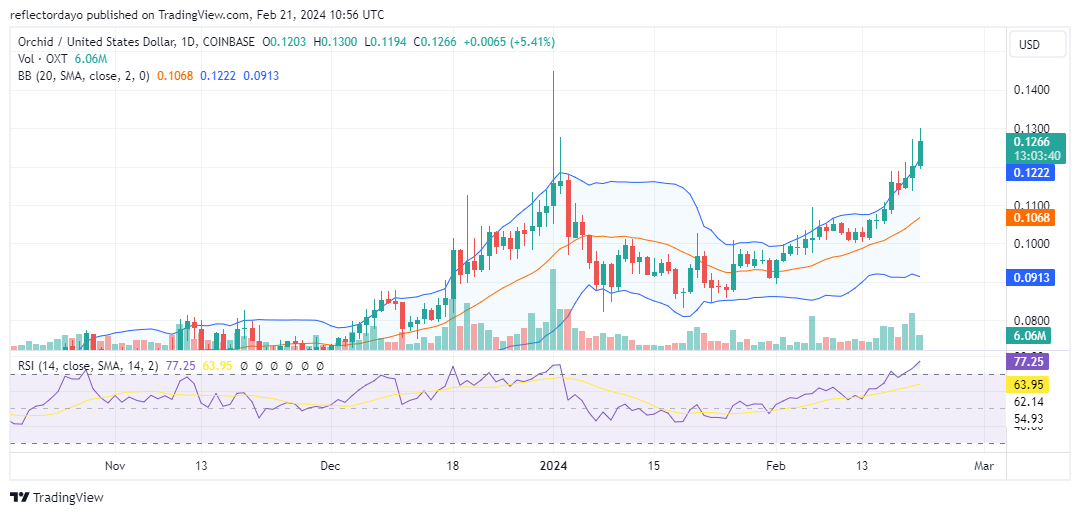
Throughout December 2023, the Orchid market maintained a consistent upward trend, culminating in a hyperbullish surge on the first day of 2024, breaking through multiple resistance levels to reach a peak of $0.145. This surge provided ample opportunity for bears to initiate a bear market. The ensuing Orchid bear market was similarly aggressive but short-lived, lasting only six days before bulls intervened around the $0.085 mark.
Orchid Market Data
- OXT/USD Price Now: $0.128
- OXT/USD Market Cap: $127 million
- OXT/USD Circulating Supply: 979 million
- OXT/USD Total Supply: 1 billion
- OXT/USD CoinMarketCap Ranking: #348
Key Levels
- Resistance: $0.130, $0.135, and $0.140.
- Support: $0.115, $0.100, and $0.090.
The Orchid Market Analysis: The Indicators’ Point of View
Following a bullish intervention, the price action began exhibiting a rectangle pattern with a bandwidth spanning between the $0.085 and $0.100 price levels. This pattern suggests market indecision despite the notable bandwidth. However, as confirmation of the prevailing bullish sentiment in the Orchid market despite a significant price correction, the market broke out of the rectangle, now tracing the path of January 1’s high.
The continuous bullish movement in December has notably impacted volatility levels, contributing to the growing formidability of bearish positions. Analysis of the chart reveals candlesticks with significant upper shadows, this crypto signal indicates the possible buildup of bearish pressure in higher price zones as the bull market progresses. While the Bollinger Bands indicator reflects volatility, the dominance of bulls is evident through both the upper curve and the moving average curve.
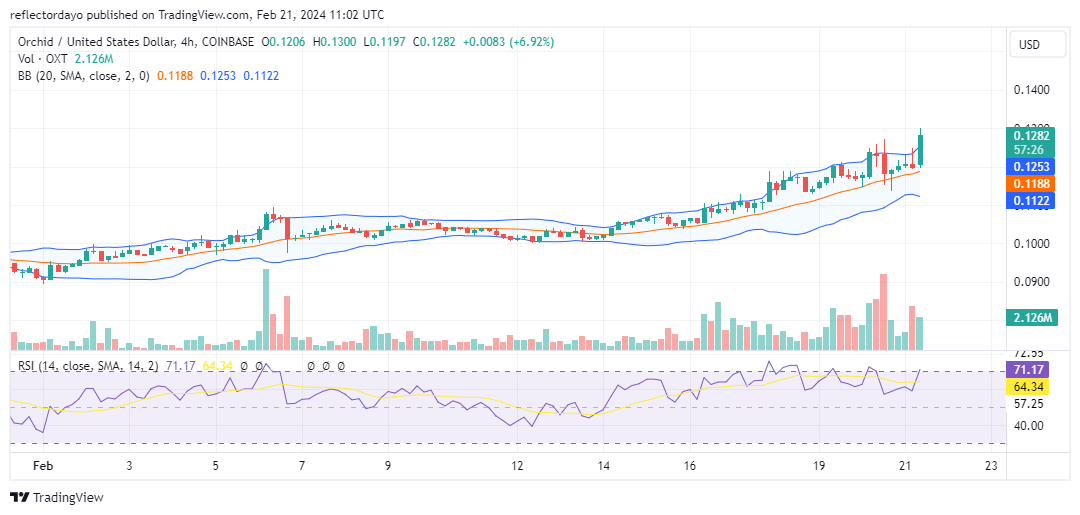
OXT/USD 4-Hour Chart Outlook
Investors should anticipate a continued upward surge in price based on the volume of trade indicator. In the current 4-hour trading session, a notable histogram supports the presence of strong bullish candlesticks. However, the significant upper shadow suggests the presence of bears in the market, albeit potentially not dominant. The next support level could materialize around $0.127.