Origin Protocol (OGN/USD) Bulls Rally to Safeguard $0.18 Support, Upholding Strength
Estimated Reading Time: 3 minutes
Don’t invest unless you’re prepared to lose all the money you invest. This is a high-risk investment and you are unlikely to be protected if something goes wrong. Take 2 minutes to learn more
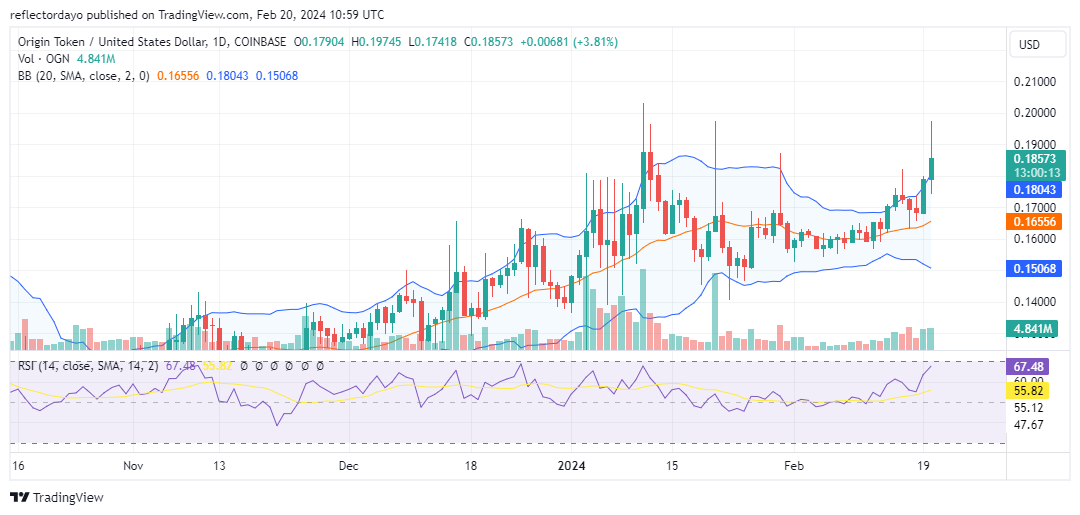
The Origin Protocol market appears to be gaining bullish momentum following its breakout from the narrow price range around $0.16. Bulls swiftly secured a pivotal support level at $0.17, and in today’s trading session, the market surged above the $0.18 price mark. Furthermore, bullish activities observed thus far in today’s trading session have propelled the market close to the high of January 11th, which stands at $0.20, before a reversal ensued, triggered by the onset of bearish market conditions at that level.
Origin Protocol Market Data
- OGN/USD Price Now: $0.183
- OGN/USD Market Cap: $105 million
- OGN/USD Circulating Supply: 573 million
- OGN/USD Total Supply: 1 billion
- OGN/USD CoinMarketCap Ranking: #401
Key Levels
- Resistance: $0.190, $0.20, and $0.210.
- Support: $0.170, $0.165, and $0.160.
The Origin Protocol Market Analysis: The Indicators’ Point of View
The surge in liquidity within the bull market has significantly heightened volatility levels in the Origin Protocol market. Consequently, we are witnessing a notable increase in price retracement. As a result, there is apprehension that the current bullish momentum may be curtailed, given the vigor of the ongoing price correction in the vicinity of the $0.20 price level. Nonetheless, it is evident that bulls are rallying around the $0.18 support level in an effort to sustain the bullish trend.
Upon examining the indicators, however, there appears to be potential for further bullish activity. The Relative Strength Index (RSI) still indicates momentum hovering around the 65.43 level, signifying robust bullish momentum. This crypto signal suggests that traders may remain inclined to purchase as the RSI line continues its upward trajectory.
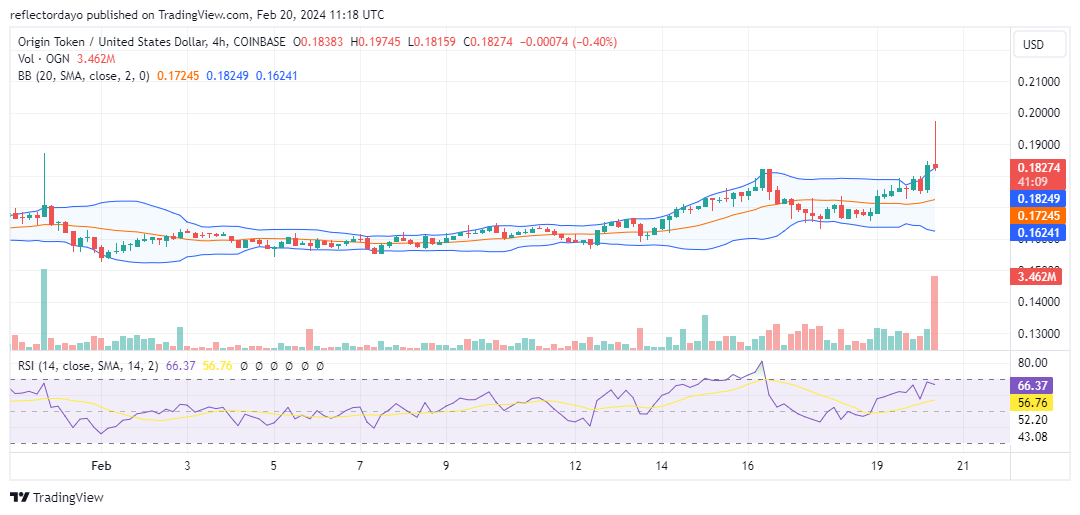
OGN/USD 4-Hour Chart Outlook
However, based on the 4-hour chart analysis, the candlestick pattern observed in the current session indicates mounting selling pressure. The appearance of the inverted hammer candlestick, characterized by a pronounced upper shadow at the peak of the trend, suggests a potential bearish reversal. This formation signifies that following an upward movement, sellers exerted pressure, driving the price down from its peak, hinting at a possible shift in market sentiment from bullish to bearish. It is hoped that bulls will be able to defend their position at $0.18 against this increasing bearish pressure.