Lucky Block Price Prediction: LBLOCK/USD Slumps below $0.0080; Opportunity to Buy
Estimated Reading Time: 2 minutes
Don’t invest unless you’re prepared to lose all the money you invest. This is a high-risk investment and you are unlikely to be protected if something goes wrong. Take 2 minutes to learn more

Free Crypto Signals Channel
The Lucky Block price prediction falls below the 9-day and 21-day moving averages as the price becomes cheaper for new buyers to enter.
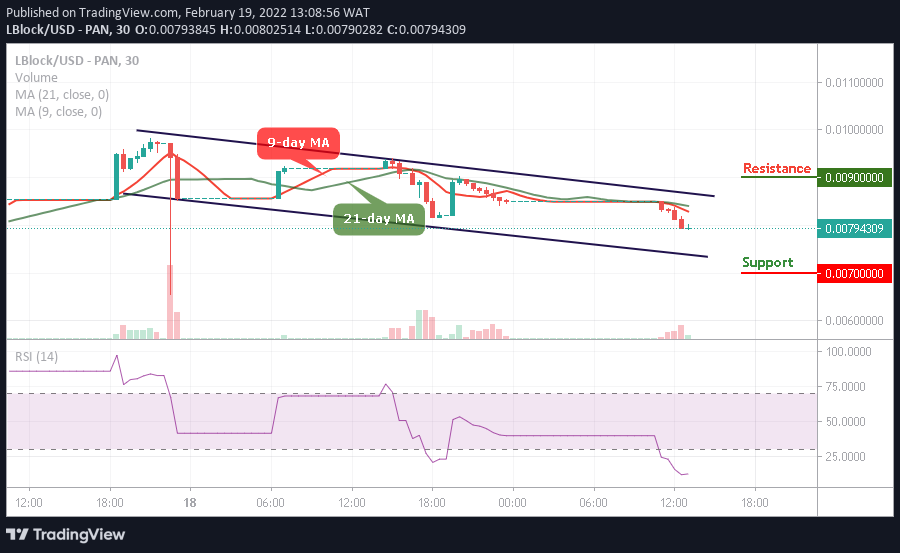
LBLOCK/USD Medium-term Trend: Bearish (30 Minutes Chart)
Key Levels:
Resistance levels: $0.0090, $0.0095, $0.0100
Support levels: $0.0070, $0.0065, $0.0060
LBLOCK/USD is dropping below $0.0080 as the coin moves to give room for new buyers to enter into the market and the existing buyers could buy the dip. Therefore, if the sellers continue to push the market further lower once again, bears can expect immediate support below to be located at the $0.0078 level.
Lucky Block Price Prediction: LBLOCK Ready for a Rebound
At the time of writing, the Block Lucky price continues to drop, and this would be a good opportunity for the new buyers to come into the market. The coin may prepare to fall more as the technical indicator Relative Strength Index (14) moves into the oversold region. Beneath this, further supports could be found at $0.0070, $0.0065, and $0.0060.
On the contrary, if the buyers can hold the current market value and climb higher, the bulls can expect immediate resistance to be located at $0.0085. Above this level, higher resistance may be found at $0.0090, $0.0095, and $0.0100 levels.
LBLOCK/USD Medium-term Trend: Bearish (15 Minutes Chart)
On the 15-minute chart, the Lucky Block (LBLOCK) ranges as the buyers are coming into the market which could bring the coin to cross above the 9-day and 21-day moving averages. LBLOCK/USD is trading at $0.0080.
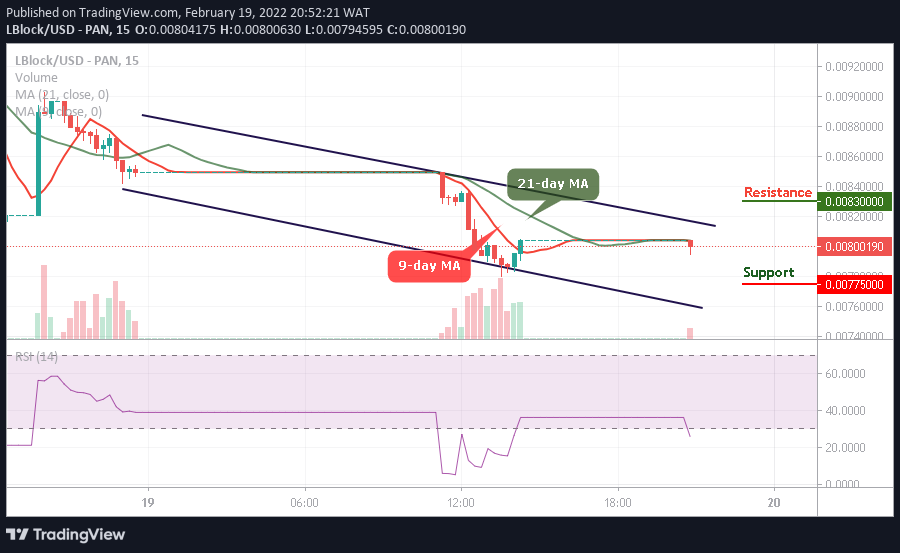
Looking at it from above, the buyers are getting ready to spike towards the upper boundary of the channel, higher resistance could lie at $0.0083 and above, but the further bearish movement could hit the support at $0.0077 and below as the technical indicator Relative Strength Index (14) heads to the oversold region.
Read more: