Tamadoge (TAMA/USD) Inch Closer to $0.006: Minor Shifts Detected
Don’t invest unless you’re prepared to lose all the money you invest. This is a high-risk investment and you are unlikely to be protected if something goes wrong. Take 2 minutes to learn more

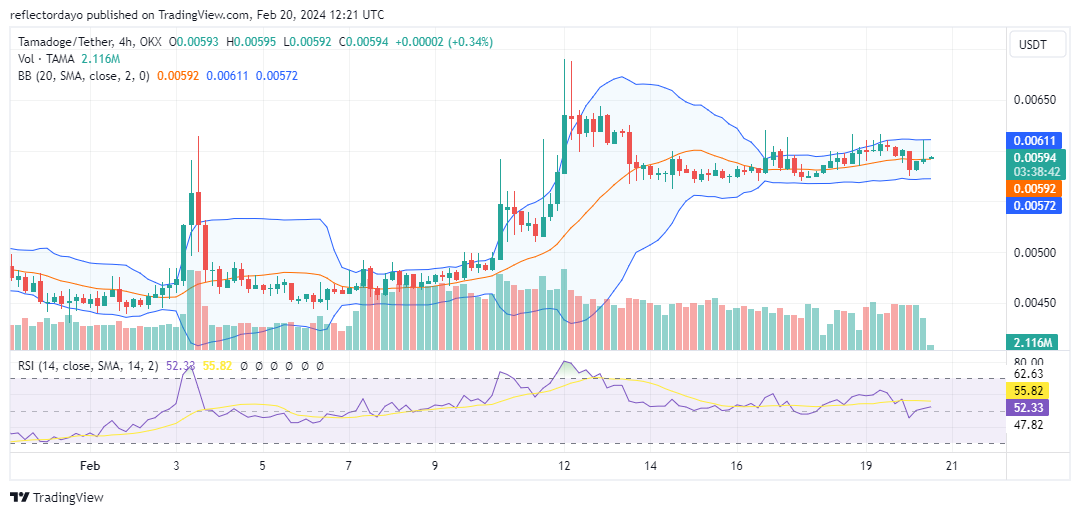
Since February 13th, when bulls intervened around the $0.0057 price level, demand has aligned with supply, establishing an equilibrium price. Consequently, the market has maintained a sideways range at this price level since then. However, from February 17th to the present, there have been slight adjustments in the TAMA/USD market dynamics. Bulls have identified a marginally higher support level at approximately $0.00581.
Key Levels
- Resistance: $0.013, $0.014, and $0.015.
- Support: $0.0045, $0.0040, and $0.0035.
TAMA/USD Price Analysis: The Indicators’ Point of View
The establishment of this slightly elevated support level is poised to facilitate a gradual upward price trajectory, potentially enabling a surpassing of the $0.006 threshold, provided that bulls persist in identifying enhanced rebound opportunities. However, as per the indicators, the TAMA/USD market is evidently in a state of equilibrium. The present trading session manifests as a doji candlestick pattern, aligning with the sideways movement of the 20-day moving average. Similarly, the Relative Strength Index (RSI) hovers close to the midpoint level. While there was an initial uptick in volatility over the past two days, prolonged market stasis could lead to further convergence of the Bollinger Bands, prolonging the consolidation phase.
Tamadoge Short-Term Outlook: 1-Hour Chart
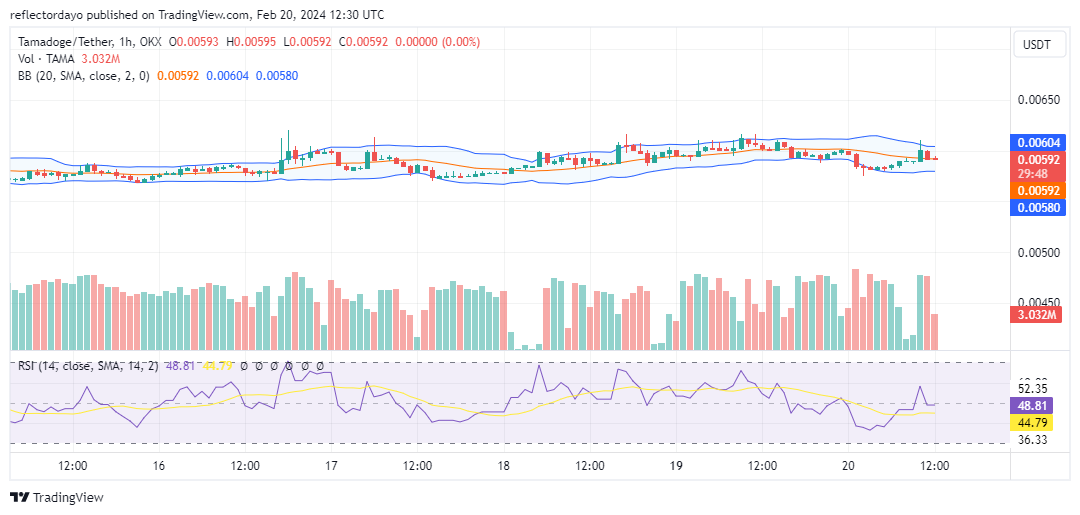
Examining the current 1-hour session, the candlestick portraying this specific trading period is a doji, complemented by a notable histogram from the volume of trade indicator. The robust histogram indicates active involvement from both bulls and bears, yet the market remains indecisive about its direction. Should this indecision persist into the following session, further convergence of the Bollinger Bands may occur. This crypto signal, commonly referred to as a volatility squeeze, often precedes a pronounced bullish price movement.
Buy Tamadoge!
Tamadoge 🤝 Polygon
Update:
🐶 TAMA V2 has been airdropped to the majority of wallets.
🐶 Playable Tamadoge NFTs on #Polygon have been sent to owners.
🐶 All Tamadoge apps have been update and $TAMA V2 prizes can be claimed.Play now and enjoy the low gas fees across the… pic.twitter.com/HlFqwykS42
— TAMADOGE (@Tamadogecoin) February 8, 2024
Do you want a coin that will be 100 times more valuable in the next few months? That is Tamadoge. Buy TAMA today!
