The Aave Market (AAVE/USD) Reattempts the $80 Resistance Price Level
Estimated Reading Time: 2 minutes
Don’t invest unless you’re prepared to lose all the money you invest. This is a high-risk investment and you are unlikely to be protected if something goes wrong. Take 2 minutes to learn more
The Aave market began its upside journey in mid-June, and it has gained upside traction since then. On June 25, liquidity in the bull market exploded, launching the market near the $80 resistance level. Liquidity in the bear market was also triggered at this price level, but buyers were able to secure a higher demand level to salvage the bullish trend.
The Aave Market Data
- AAVE/USD Price Now: $75.92
- AAVE/USD Market Cap: $1,100,249,233
- AAVE/USD Circulating Supply: 14,472,277 AAVE
- AAVE/USD Total Supply: 16,000,000 AAVE
- AAVE/USD CoinMarketCap Ranking: #40
Key Levels
- Resistance: $80.00, $85.00, and $90.00.
- Support: $60.00, $55.00, and $50.00.
Price Prediction for the Aave Market: The Indicators’ Point of View
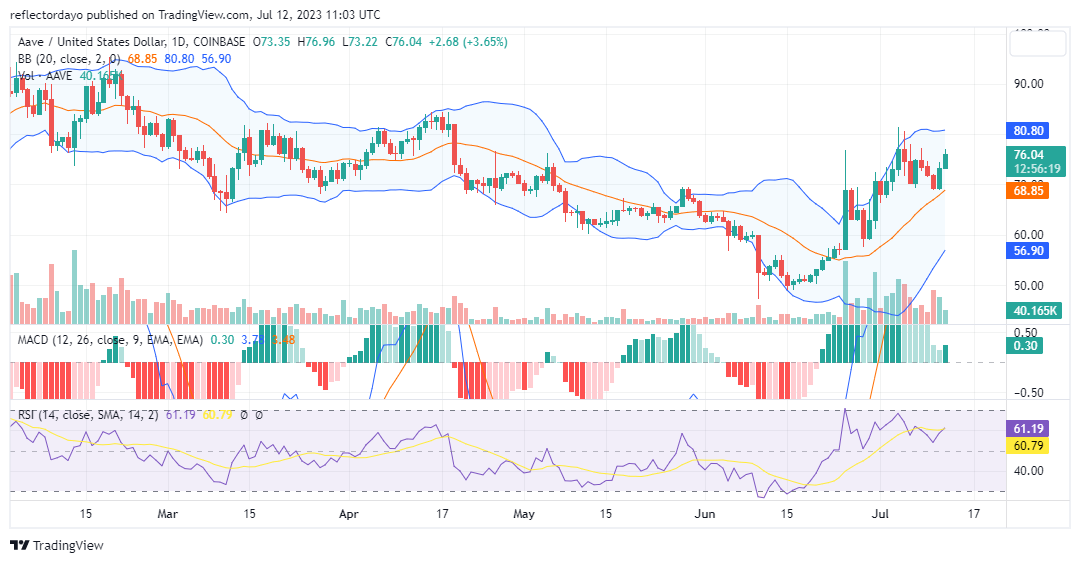
After the Aave market price retracement from the $76.84 price resistance level, a higher support level was formed around the $60.00 price level, which is above the 20-day moving average. This was able to keep the market in a bullish direction and keep the volatility level on the high side.
The high volatility shows that investors’ interest in the market is high, and with the bulls currently having the upper hand, it is very likely that the crucial $80.00 resistance price level will soon be broken.
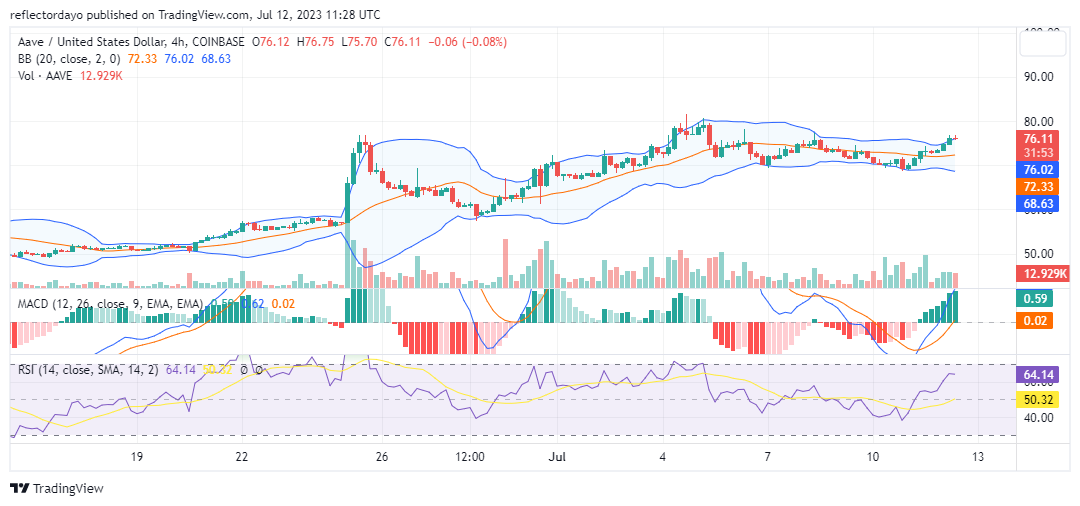
AAVE/USD 4-Hour Chart Outlook
In the 4-hour timeframe, we see the market ranging sideways after hitting the crucial $80.00 resistance price level. After the price retracement, buyers regrouped around the $70.00 price level, which is a near-price level to the main resistance. The position of the sellers in the market is under pressure as the market is currently above its 20-day moving average.
Bulls are pushing against the resistance, even though the price channel, as portrayed by the Bollinger Bands indicator, is narrow. But the upper band of the Bollinger indicator is beginning to move upward as it responds to bullish activity.