SPONGE/USD ($SPONGE) Bulls Hold Ground Amid Volatility Spike
Estimated Reading Time: 3 minutes
Don’t invest unless you’re prepared to lose all the money you invest. This is a high-risk investment and you are unlikely to be protected if something goes wrong. Take 2 minutes to learn more

Previous analysis of the $SPONGE market highlighted the bulls’ efforts to maintain support around the $0.0000037 price level. In today’s trading session, the market experienced a notable increase in volatility, causing wider price swings. Fortunately for buyers, these movements have remained mostly on the upside of the $0.0000037 zone.
This price behavior underscores the resilience of the bulls, as they continue to defend this key support level despite heightened market fluctuations.
Key Price Levels
- Resistance: $0.0000040, $0.0000045, $0.0000050
- Support: $0.0000030, $0.0000025, $0.0000020
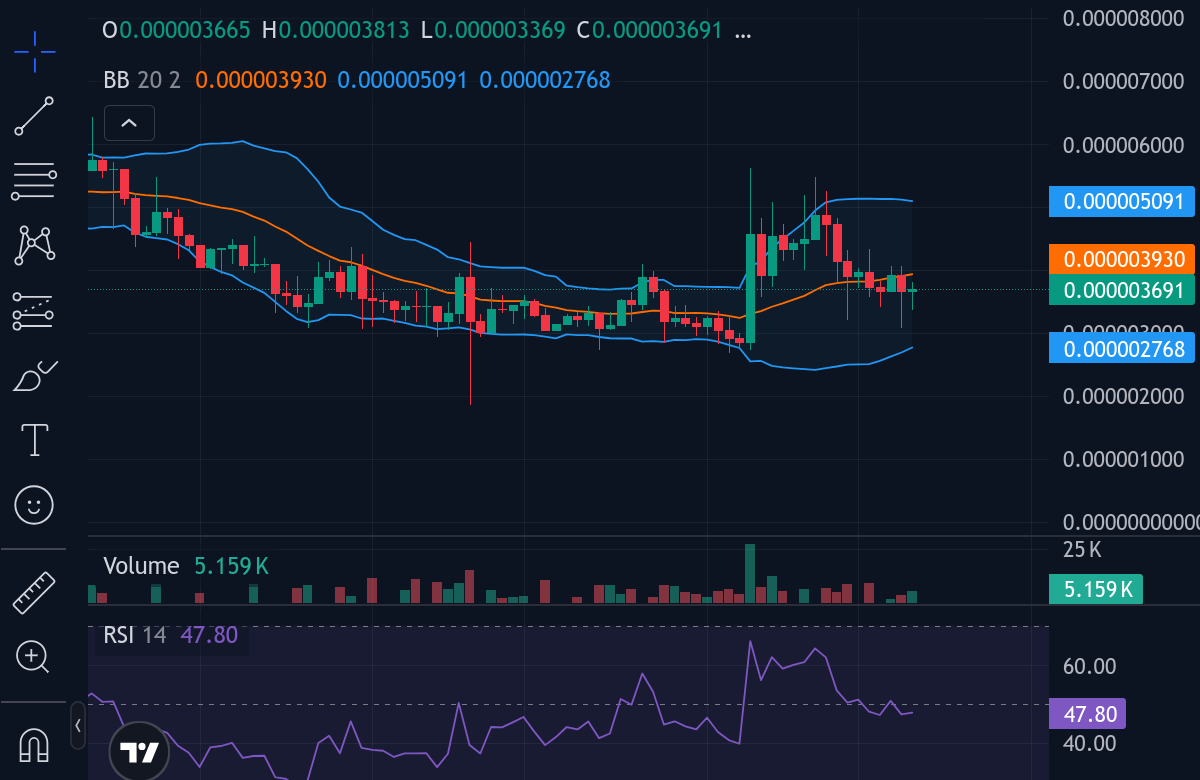
SPONGE/USD Daily Chart
Since November 5, the $SPONGE price action has consistently maintained movement above the $0.0000037 level, with only brief dips below this threshold. This behavior highlights the strength and resilience of the bulls at this critical support zone. However, bearish pressure remains persistent, continually testing the durability of this level.
Traders and analysts are closely observing the market’s reaction around $0.0000037, especially given the appearance of recent lower candlestick shadows, which reflect repeated attempts by sellers to push the price downward.
If a sustained breakdown occurs, the market could decline toward the $0.0000027 region. Conversely, if the bulls successfully absorb the bearish pressure at this support, the next notable upside target may be the $0.000005 level.
For now, the market continues to trade near equilibrium, awaiting a decisive move in either direction.
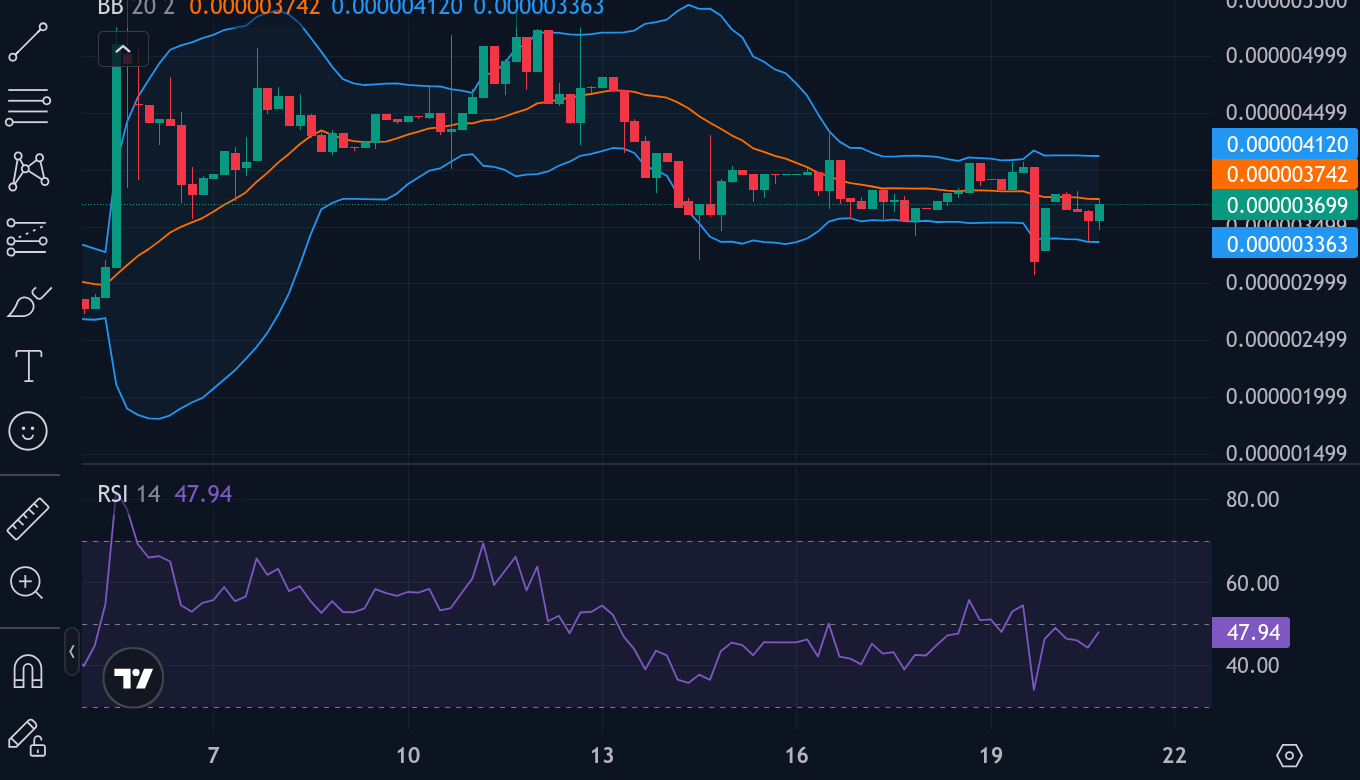
SPONGE/USD 4-Hour Chart
On the 4-hour chart, the market continues to move in a consolidation phase similar to what is observed on the daily timeframe. However, within this shorter time frame, the bears appear to have a slight advantage. The Relative Strength Index (RSI) sits just below the midpoint—around the 47 level—indicating weak bearish momentum rather than strong downward pressure.
Despite this, price action remains within a range still influenced by bullish support, suggesting that the market is not yet fully tilted in favor of the bears. The next decisive move will depend on whether buyers can reclaim momentum or if sellers strengthen their position in the coming sessions.
Buy SPONGE/USD!
Time to hunt some bears pic.twitter.com/TZA04OKnWH
— $SPONGE (@spongeoneth) November 19, 2025
Join the SPONGE community and get in on the next big crypto opportunity! Buy Sponge ($SPONGE) today