Litecoin (LTC/USD) Trade Features Around $175
Estimated Reading Time: 3 minutes
Don’t invest unless you’re prepared to lose all the money you invest. This is a high-risk investment and you are unlikely to be protected if something goes wrong. Take 2 minutes to learn more
Litecoin Price Prediction – August 17
The LTC/USD trade now features around a $175 trading line as it cannot still push to a higher resistance point at $200. As of writing, the crypto records a percentage rate of around -1.44. Even with that negative rate in percentages, the sentiment remains bullish and coupled with worthy of investment.
LTC/USD Market
Key Levels:
Resistance levels: $200, $240, $280
Support levels: $150, $130, $110
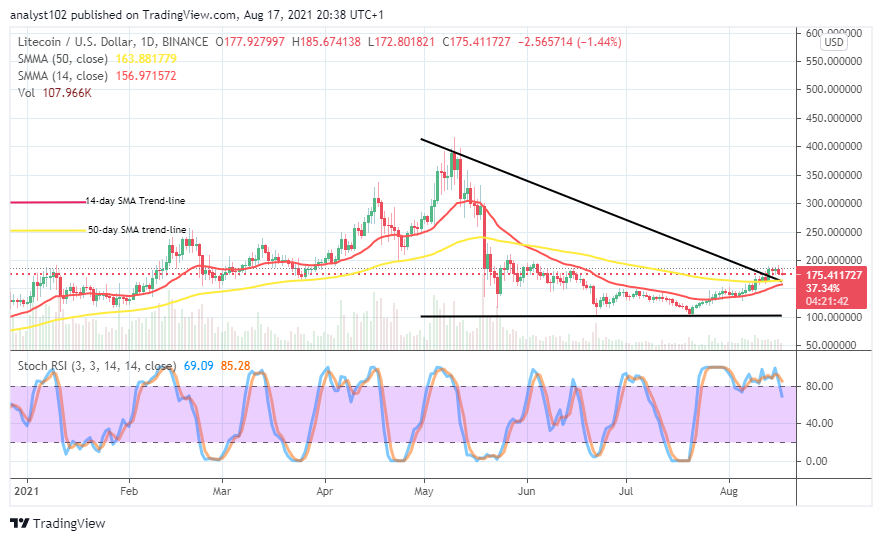
LTC/USD – Daily Chart
The LTC/USD daily chart exhibits that the crypto trade features around the level of $175. Recently, there had been several upward striving efforts made in the market with less impactful outcomes. The 50-day SMA trend-line is above the 14-day SMA trend-line. And, the bearish trend-line drew to locate the point slightly breached to the upside from the buy signal line of the bigger SMA. The Stochastic Oscillators have unwittingly crossed the lines southbound briefly against the range of 80 to indicate a downward force is in motion.
The LTC/USD trade features around %175; what could be the next price direction?
Presently, the active price action of the LTC/USD market can be more easily visible on smaller time charts. As the crypto trade features around $175, it would be technically ideal that traders apply 4-hour and 1.hour time frames to decide when to exert a position. Bulls needed to look out for when the market gets to a lower trading zone to make a rebounding move signal before joining.
On the downside, the LTC/USD market bears needed to re-hold price for a headlong downward push against some supports beyond $160 to be able to set on a profiteering motion. However, every line of trade precautionary measure should have adhered while shorting order is taking to avoid an unnecessary whipsawed-trading situation in no time. In the meantime, a continual trade pause below the resistance level of $200 will probably allow some downs to play out afterward.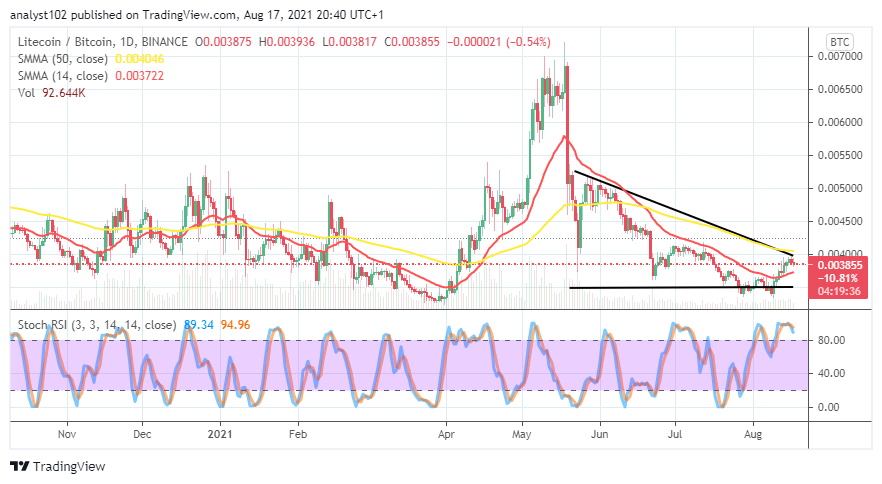
LTC/BTC Price Analysis
In comparison, Litecoin’s trending capacity is still seen in a recovery-moving manner as paired with Bitcoin. The duo-crypto trade features around a less-higher trading zone beneath the bigger SMA trend-line. The 14-day SMA indicator has a northward-curve posture below the 50-day SMA trading indicator. And, the bearish trend-line drew to play a backing resistance role to the bigger SMA trend-line. The Stochastic Oscillators have crossed the lines slightly southbound in the overbought region, signaling the possibility of seeing the base crypto falling in strength as placed with the flagship counter crypto coin.
Note: Cryptosignals.org is not a financial advisor. Do your research before investing your funds in any financial asset or presented product or event. We are not responsible for your investing results.
You can purchase crypto coins here. Buy Tokens