Solana (SOL/USD) Market Trades in Ranges of $50 and $25
Estimated Reading Time: 3 minutes
Don’t invest unless you’re prepared to lose all the money you invest. This is a high-risk investment and you are unlikely to be protected if something goes wrong. Take 2 minutes to learn more

Free Crypto Signals Channel
Solana Price Prediction – July 22
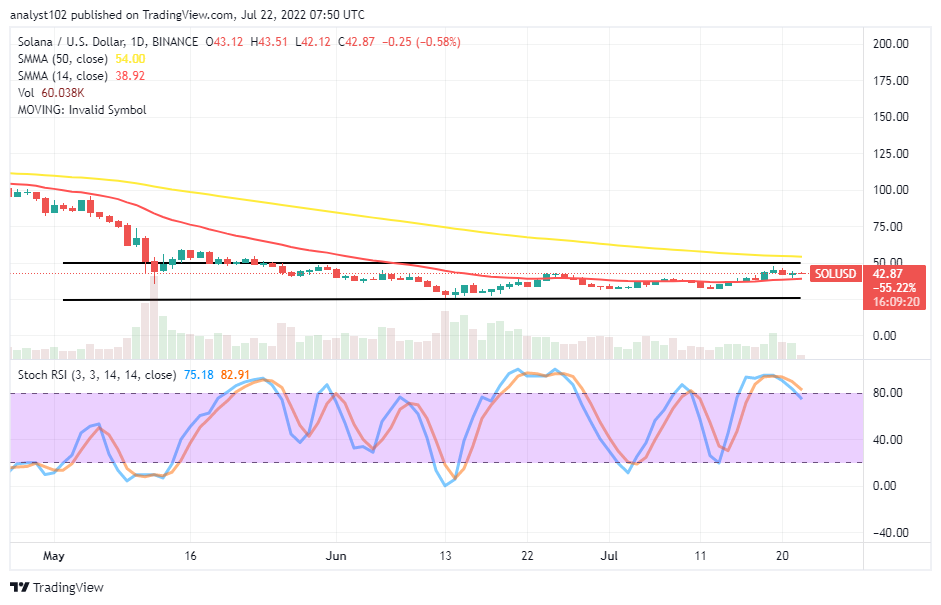
It is currently that the SOL/USD market trades in ranges of $50 and $25 over a couple of sessions. In the last few hours of today’s sessions, the price has been less active between $43 and $42 at an average minute percentage rate of 0.58 negative.
SOL/USD Market
Key Levels:
Resistance levels: $50, $75, $100
Support levels: $25, $20, $15
SOL/USD – Daily Chart
The BCH/USD daily chart showcases the crypto-economic market trades in ranges of $50 and $25 closely, below the trend line of the bigger SMA. The 14-day SMA indicator is in the range values underneath the 50-day SMA indicator. The Stochastic Oscillators are in the attempt to cross southbound against the range at 80. The upper horizontal line drew at a higher point while the lower one is drawn at the smaller value line to have a clearer picture of the range-bound zones.
Will the SOL/USD market break out of the range-bound zones soon?
There has been no reliable signal to denote either a breakout or a breakdown in the SOL/USD trade activities as the crypto market trades in ranges of $50 and $25. It appears that some declines may occur necessarily to give room for correction. If that assumption is validated, there will be a tendency that the market valuation will drop purposely to rebuild its support from around the lower range point afterward.
On the downside of the technical analysis, the SOL/USD trading outlook suggests bears are likely to be pushing against any buying attempts around the upper range. Nevertheless, a sudden breakout at the point will nudge the crypto’s worth to a higher trading spot above the $50 resistance level. But, the price may encounter tough resistance around the 50-day SMA at $54.
SOL/BTC Price Analysis
Solana has somewhat been pushing in a rallying format against Bitcoin. The cryptocurrency pair market trades in ranges around a higher zone involving the presence of the SMAs. The 14-day SMA indicator is closely underneath the 50-day SMA indicator. The Stochastic Oscillators have crossed southbound from the overbought region above the 40 range. And they are yet pointing toward the south direction. That shows the base crypto may be debasing against the flagship counter crypto for a while.
Note: Cryptosignals.org is not a financial advisor. Do your research before investing your funds in any financial asset or presented product or event. We are not responsible for your investing results.
“Lucky is up more than 50% today but still more than 430% from All Time Highs!
The opportunity to bank BIG is now!
You can purchase Lucky Block here. Buy LBlock