Ethereum (ETH/USD) Intensifies Pushing northwardly Through Variant Resistances to Average the High Level of $4,400
Estimated Reading Time: 3 minutes
Don’t invest unless you’re prepared to lose all the money you invest. This is a high-risk investment and you are unlikely to be protected if something goes wrong. Take 2 minutes to learn more
Ethereum Price Prediction – May 10
The ETH/USD market operation has continued to increase in surging northwardly on a higher note. As of writing, the crypto’s value is trading at around the market price of $4,125 with about a 5.02% increase.
ETH/USD Market
Key Levels:
Resistance levels: $4,400, $4,800, $5,200
Support levels: $3,600, $3,200, $2,800
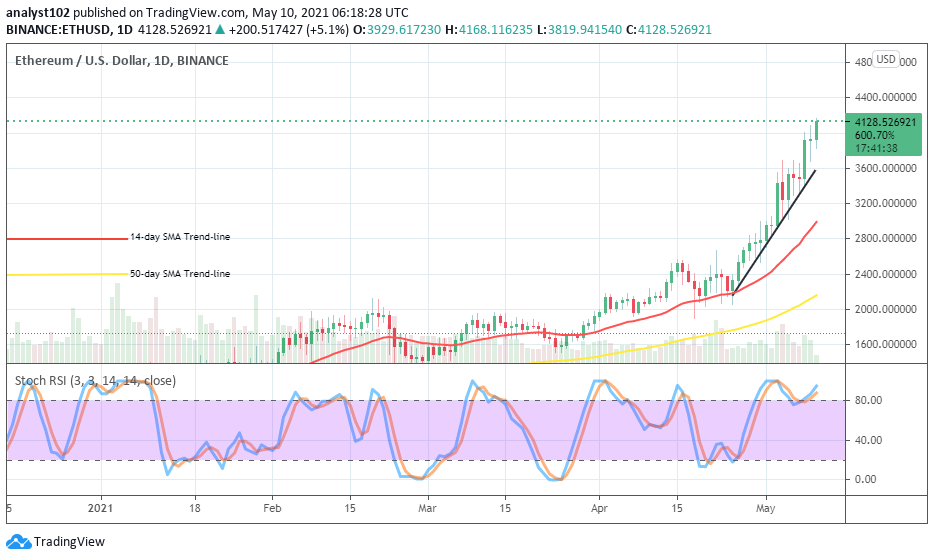
ETH/USD – Daily Chart
The ETH/USD daily chart showcases a kind of straight-line bullish run in the crypto’s trading activities as paired with the fiat currency. On May 7, another bullish candlestick occurred breaking the crucial $3,600 resistance to nudge the market into a higher trading zone of in-between the levels of $4,000 and $4,400. The bullish trend-line has drawn to place a support index below the $3,600 vital point. The 14-day SMA trend-line is over the 50-day SMA indicator as they are both far below the current trading zone of the market presently. The Stochastic Oscillators are in the overbought region pointing towards the north to suggest that some buying pressures are still ongoing.
Will the ETH/USD present uptrend momentum increase further?
It currently appears that the kind of buying pressures being exhibited by the ETH/USD bulls in the market will continue waxing stronger to keep the uptrend intact and extensional in the next session. A sudden uptrend price reversal in between the values of $4,000 and $3,600 may crop in a slight sell-off trading situation of the market. Therefore, bulls need to be wary of those points.
On the downside, bears need to stay off the market presently for a while as it is still indicated by the Stochastic Oscillators that the buying pressures are not yet exhausted. Equally, they need to be wary of fake uptrend price reversal after a line of rejections that may come up at a higher trading zone later on.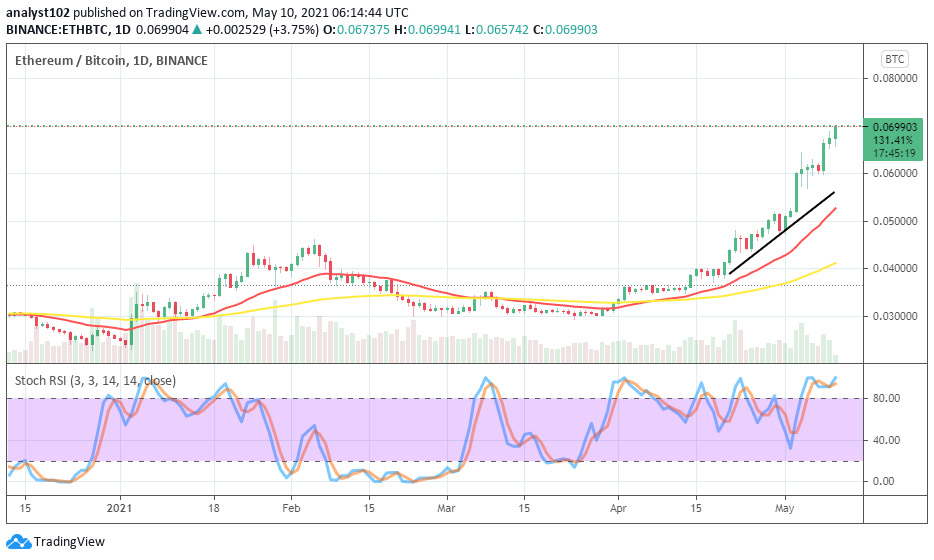
ETH/BTC Price Analysis
Considering the market weight between ETH and BTC presently, the counter instrument has continually being overwhelmed as placed with the base tool. The base coin has on May 8, added a bullish candlestick to elongate its purchasing stance against the counter crypto to another higher trading zone far over the technical trading indicators. The 50-day SMA is underneath the 14-day SMA. And, they both point toward the north. The Stochastic Oscillators are in the overbought region trying to indicatively point to the north as well. All in all, the base crypto seems to dominate the market purchasing space more at the low price action being put up by its counter trading instrument.
Note: cryptosignals.org is not a financial advisor. Do your research before investing your funds in any financial asset or presented product or event. We are not responsible for your investing results.