Ethereum Struggles above $4,057 Support, May Slide to $3,876 Low
Estimated Reading Time: 2 minutes
Don’t invest unless you’re prepared to lose all the money you invest. This is a high-risk investment and you are unlikely to be protected if something goes wrong. Take 2 minutes to learn more

Ethereum Price Long-Term Analysis: Bearish
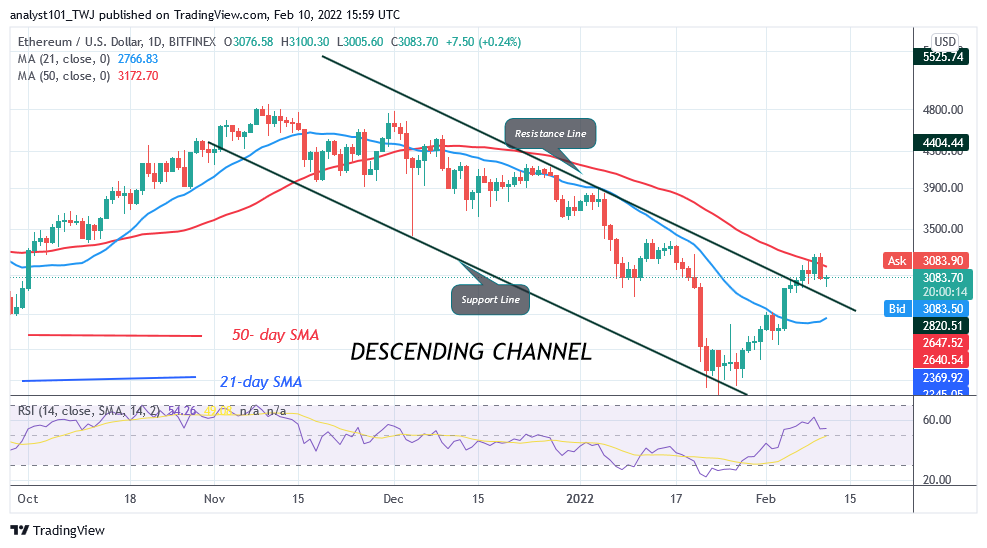
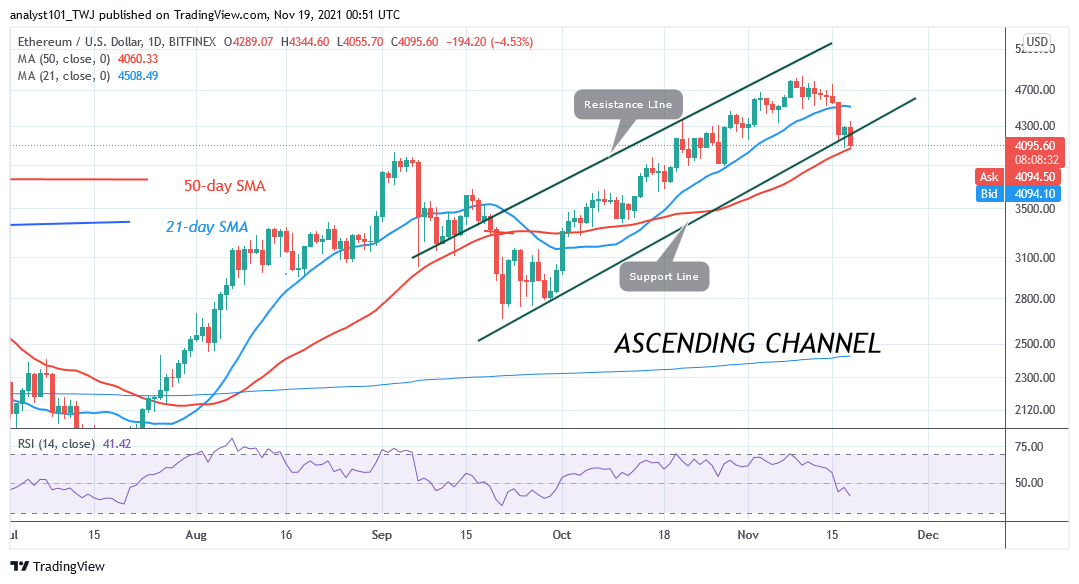
Ethereum (ETH) price has broken below the 21-day line moving average but it is testing the 50-day line moving average to break below it. When price breaks below the 50-day line moving average, the selling pressure will be accelerated. Ether will further decline to $ 3,905 low. However, if the 50-day line moving average holds, Ether will begin resumption of an upward move. Buyers will revisit the highs of $4,745 and $4,800. They will have to push Ether above $4,700 high to be out of a downward correction
Ethereum Indicator Analysis
The crypto’s price is below the 21-day line moving average but above the 50-day line moving average. Ether is approaching the bearish trend zone. Ether has fallen to level 47 of the Relative Strength Index for period 14. The biggest altcoin is in the bearish trend zone and capable of falling on the downside. Ether is below 20% area of the daily stochastic. The altcoin has fallen to the oversold region. The selling pressure will soon subside.
Technical indicators:
Major Resistance Levels – $2, 600, $2,800, $3,000
Major Support Levels – $1.500, $1, 300, $1,100
What Is the Next Direction for Ethereum?
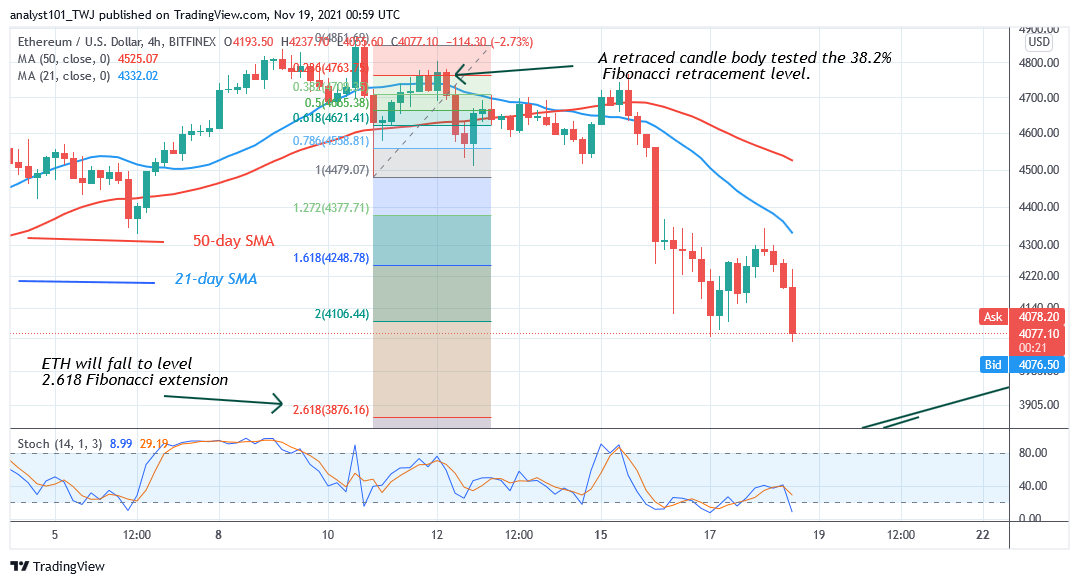
Ether is in a downward move. The crypto has fallen to the low of $4057 at the time of writing. Meanwhile, on November 10 downtrend; a retraced candle body tested the 38.2% Fibonacci retracement level. The retracement indicates that Ethereum will fall to level 2.618 Fibonacci extension or $3,876.16.
You can crypto coins here. Buy Tokens
Note: Cryptosignals.org is not a financial advisor. Do your research before investing your funds in any financial asset or presented product or event. We are not responsible for your investing results