Ethereum (ETH/USD) Market Hovers Between $2,250 and $2,000
Estimated Reading Time: 3 minutes
Don’t invest unless you’re prepared to lose all the money you invest. This is a high-risk investment and you are unlikely to be protected if something goes wrong. Take 2 minutes to learn more

Free Crypto Signals Channel
Ethereum Price Prediction – May 23
There have been a series of ups and downs, denoting that the crypto-economic market hovers between $2,250 and $2,000 for sessions. Currently, the base trading instrument is trading around the $2,071 level at a 1.47% positive.
ETH/USD Market
Key Levels:
Resistance levels: $2,250, $2,500, $2,750
Support levels: $1,750, $1,500, $1,250
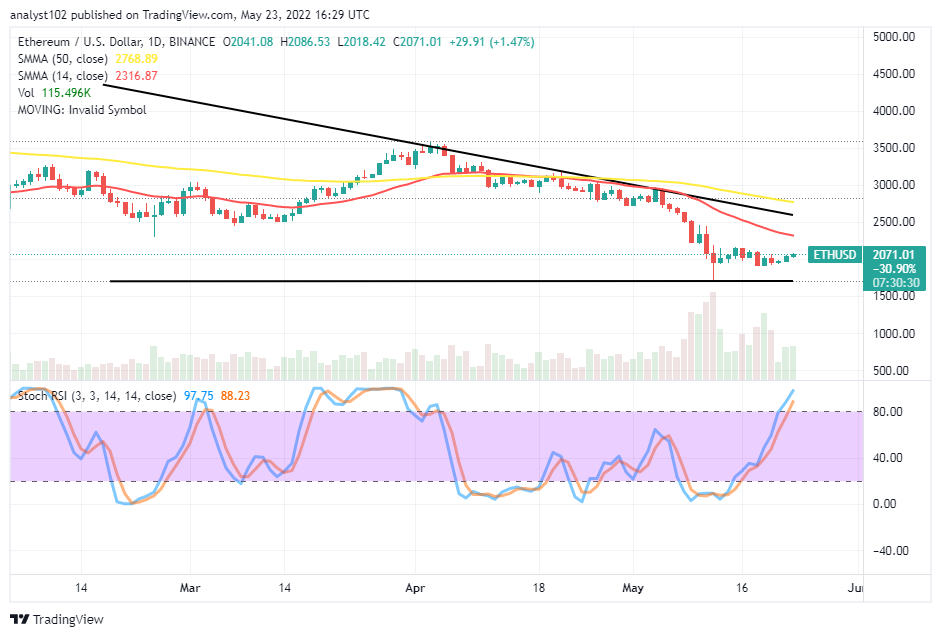
ETH/USD – Daily Chart
The daily chart reveals the ETH/USD market hovers between $2,250 and $2,000 from around May 12 until the present. The 14-day SMA indicator has slightly moved to the downside over the current trading spot of the crypto’s price underneath the 50-day SMA indicator. The Stochastic Oscillators are striving, making headway into the overbought region to possibly portend an ugly trading situation against getting some ups through the variant resistances overhead.
Can the ETH/USD market result in rallying its move for recovery out of the ranging spots?
It would require a lot of effort to get a definite direction into which the ETH/USD market will push away from the current ranging spots as the crypto-economic market hovers between $2,250 and $2,000 value lines over a couple of sessions until now. In the wake of price resulting in a consolidation movement above the support level using smaller-time frames carrying a correlation stance between a 1-hour and a 4-hour charts at a particular point in time.
On the downside of the technical analysis, the 14-day SMA indicator positions signal a firm barrier between the first two resistance levels. The movement of the Stochastic Oscillators on a low pace signifies that the crypto trade stands the possibility of losing stances if it fails to beef up strength afterward. A suddenly aggressive return of a downward-turning motion in an attempt to eventually breach southward past the $1,750 will make the trade risk opting for settlement at a lower-trading zone.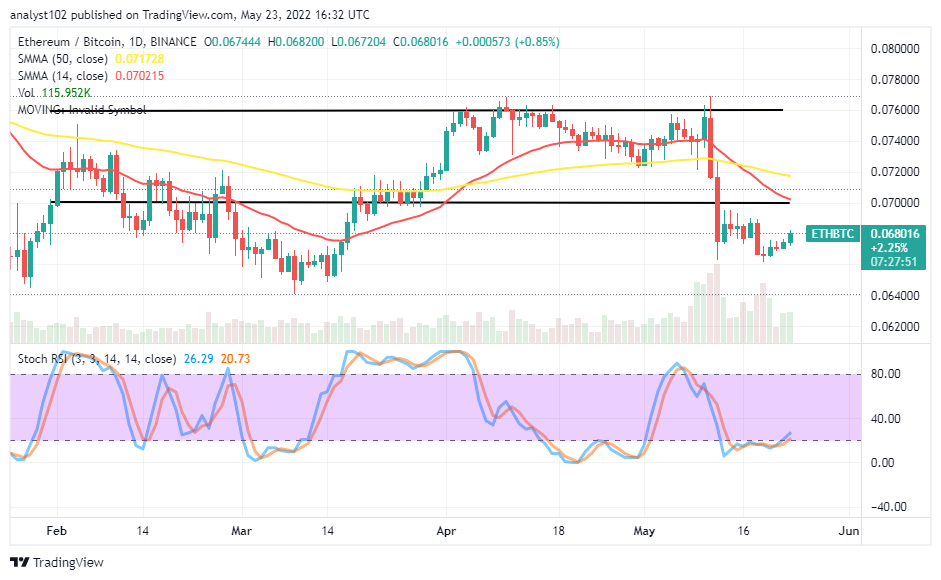
ETH/BTC Price Analysis
In comparison, Ethereum has remained downing at a lower trading spot that has the potential of letting push back against Bitcoin in no time. The cryptocurrency pair market hovers underneath the sell signal sides of the SMAs. The 14-day SMA trend line has gone past the 50-day SMA trend line to the south side. And they are over the trading area of the pairing cryptos. The Stochastic Oscillators are consolidating at the 20 range line, nearing the oversold region. However, some smaller bullish candlesticks are surfacing to negate the possibility of the base crypto debasing against its countering crypto.
Note: Cryptosignals.org is not a financial advisor. Do your research before investing your funds in any financial asset or presented product or event. We are not responsible for your investing results.
“Lucky is up more than 50% today but still more than 430% from All Time Highs!
The opportunity to bank BIG is now!
You can purchase Lucky Block here. Buy LBlock: