Lucky Block Price Prediction: LBLOCK/USD Gears Up for a Recovery
Estimated Reading Time: 3 minutes
Don’t invest unless you’re prepared to lose all the money you invest. This is a high-risk investment and you are unlikely to be protected if something goes wrong. Take 2 minutes to learn more
Lucky Block Price Prediction – September 7
The daily chart reveals that the Lucky Block price is seen forming higher as the bears may lose grip over the coin soon.
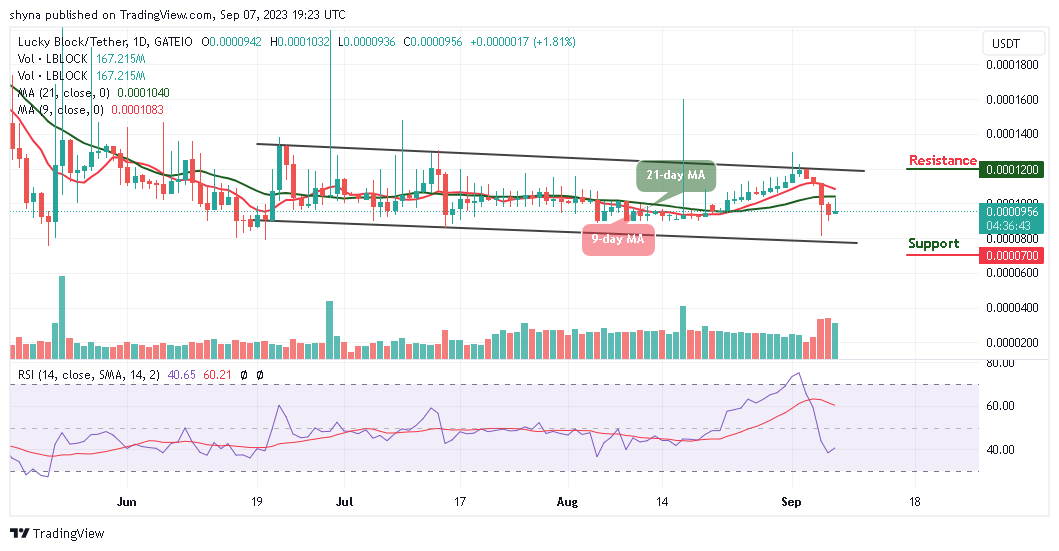
LBLOCK/USD Long-term Trend: Ranging (1D Chart)
Key Levels:
Resistance levels: $0.000120, $0.000130, $0.000140
Support levels: $0.000070, $0.000060, $0.000050
The Lucky Block price will be crossing above the upper boundary of the channel while the $0.000090 support level is the critical support where the price has been holding for some time now. However, since the past few hours, LBLOCK/USD has been trying to cross above the 9-day and 21-day moving averages and this makes the coin touch a daily high of $0.000103.
Lucky Block Price Prediction: Will Lucky Block Move Higher?
The LBLOCK/USD pair may continue to rise and break above the upper boundary of the channel if the bulls defend the $0.000090 support level. Therefore, any further bullish movement above the upper boundary of the channel may push the price to the potential resistance levels of $0.000120, $0.000130, and $0.000140.
However, this technical analysis could be invalidated if the bears break below the previous support level of $0.000090, and the Lucky Block could fall to the low of $0.000070, $0.000060, and $0.000050 support levels. Moreover, the technical indicator relative Strength Index (14) is moving to cross above the 40-level which could give more bullish movements in the next positive direction.
LBLOCK/USD Medium-term Trend: Ranging (4H Chart)
According to the 4-hour chart, the Lucky Block price is trying to move up higher as it crosses above the 9-day moving average, trading at $0.000095. The long-term moving averages may likely keep the bullish movement as the market is starting a new trend by moving toward the 21-day moving average.
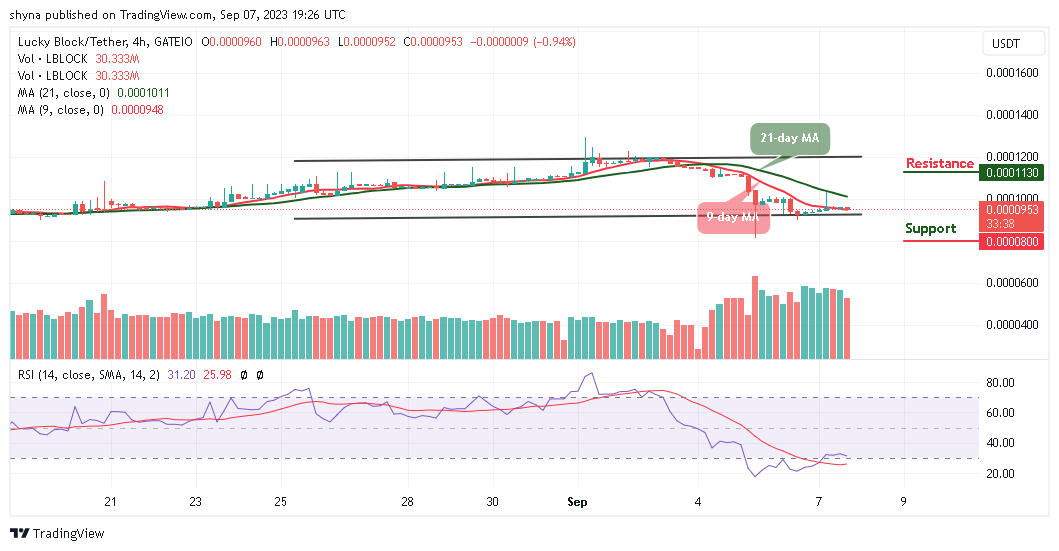
Meanwhile, if the buyers could push the price toward the channel, higher resistance could be located at $0.000113 and above. Moreover, should the bulls fail to move the current market value to the north, then, the bears may step back into the market and the nearest support level could be located at $0.000080 and above. Nonetheless, the technical indicator Relative Strength Index (14) is moving below the 35-level, preparing the coin for the north.
You can purchase Lucky Block here. Buy LBLOCK