Eigenlayer (EIGEN/USDT) Shows Signs of Potential Recovery
Estimated Reading Time: 3 minutes
Don’t invest unless you’re prepared to lose all the money you invest. This is a high-risk investment and you are unlikely to be protected if something goes wrong. Take 2 minutes to learn more

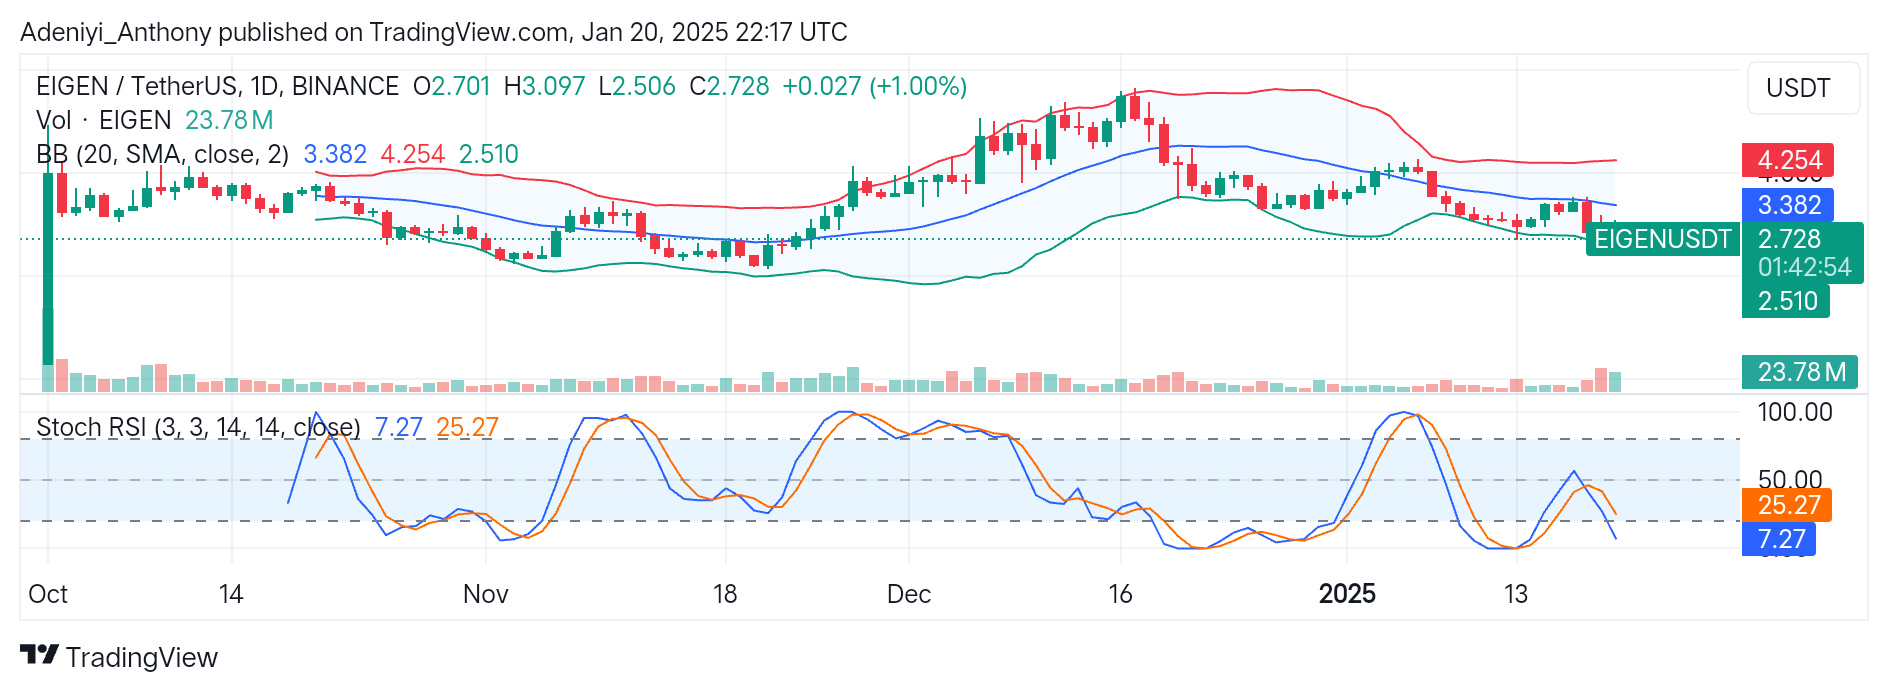
Eigenlayer against the Tether on a daily timeframe appears to be in a prolonged downtrend as exhibited by the formation of lower highs and lows. This shows the influx of bearish traders as the price approaches the $2.510 support at the lower Bollinger band.
Recently, Eigenlayer seems to be consolidating, as indicated by the narrowing Bollinger bands. This suggests reduced volatility after declining price levels, leaving traders to wait for signals for a reversal or continued downtrend as the oscillator indicates an oversold condition for the pair.
Currently, EIGEN/USDT trades at $2.728, recording a 1% gain while testing the immediate dynamic support line.
Technical Indicators
Major Resistance Levels: $3.382, $3.720, and $4.254
Major Support Levels: $2.510, $2.250, $2.000
Eigenlayer Technical Analysis
The analysis of the Eigenlayer against the Tether on the daily timeframe suggests the pair prepares for a breakout after seeing a minor uptick while approaching $2.510.
However, the positioning of the price around the lower segment of the Bollinger Bands suggests the market is dominated by bearish traders. The conventional oversold condition signals the pair could see a recovery soon provided current momentum is sustained.
On the other hand, the Stochastic RSI indicates more dip; however, in the meantime, the price may correct to the north as the indicator’s lines operate deep in the oversold region.
To this end, a breakout above the midline at $3.382 and a reversal of the lines of the Stochastic would signal the start of a recovery; otherwise, the current trend would continue.
EIGEN/USDT Analysis: What’s Next?
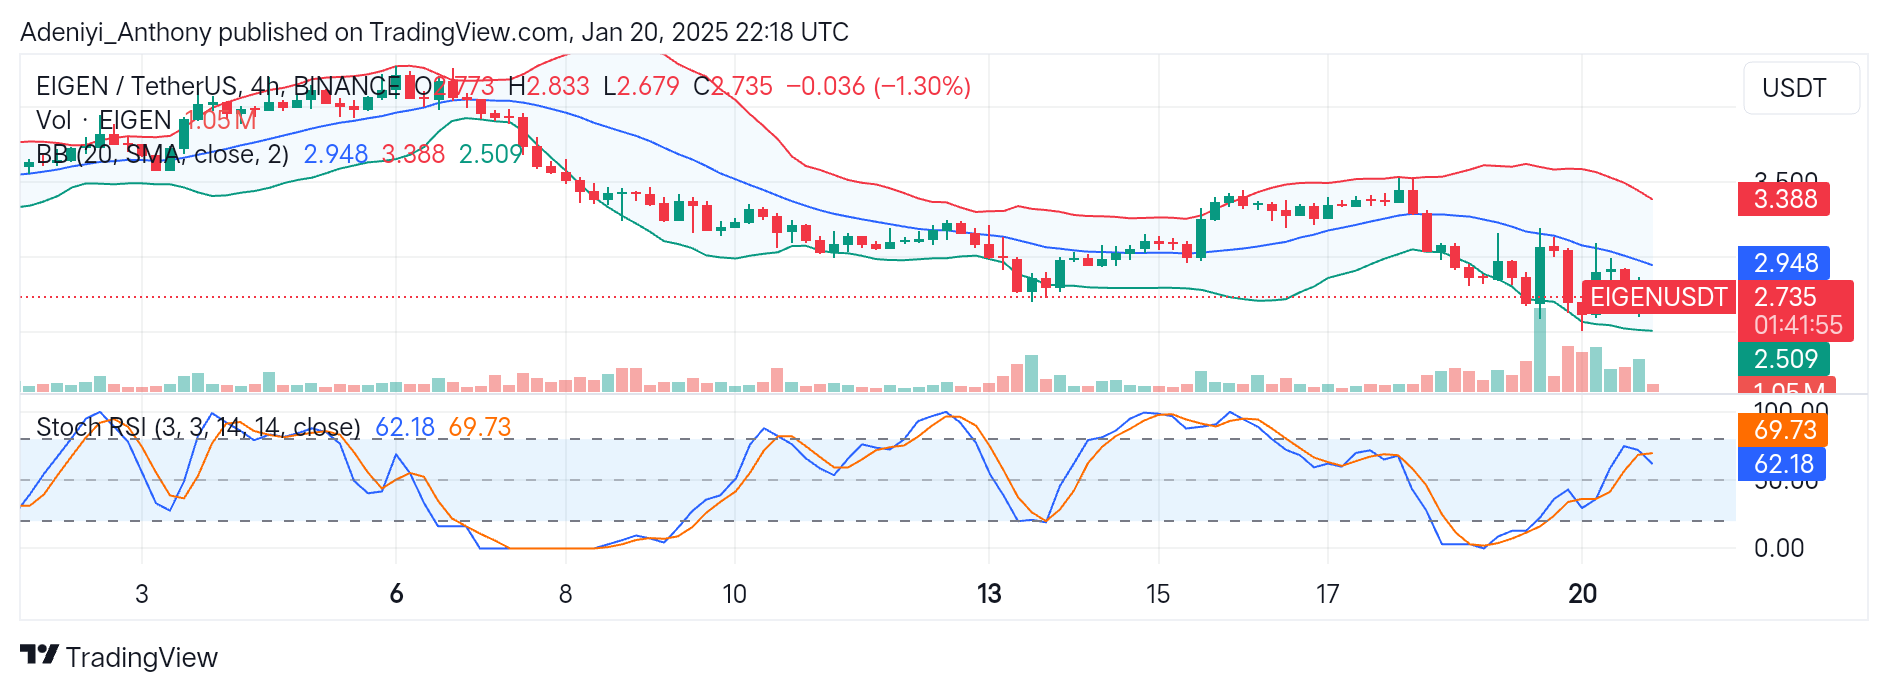
The 4-hour analysis of EIGEN/USDT shows a persistent bearish condition as the pair operates under the mid-Bollinger band. This indicates a short-term bearishness, as price positions around the lower band signal an extensive oversold condition and potential reversal in the near term.
However, the Stochastic oscillator suggests a renewed bearish tone as the lines retrace from the overbought region, indicating a pullback and a weakened bullish momentum. To this end, more price dip might surface if the price fails to hold above the $2.509 support line for a move towards $2.948 resistance.
You can purchase crypto coins here. Buy LBlock