EigenLayer (EIGEN/USDT) Fails to Hold Above $3.477
Estimated Reading Time: 3 minutes
Don’t invest unless you’re prepared to lose all the money you invest. This is a high-risk investment and you are unlikely to be protected if something goes wrong. Take 2 minutes to learn more

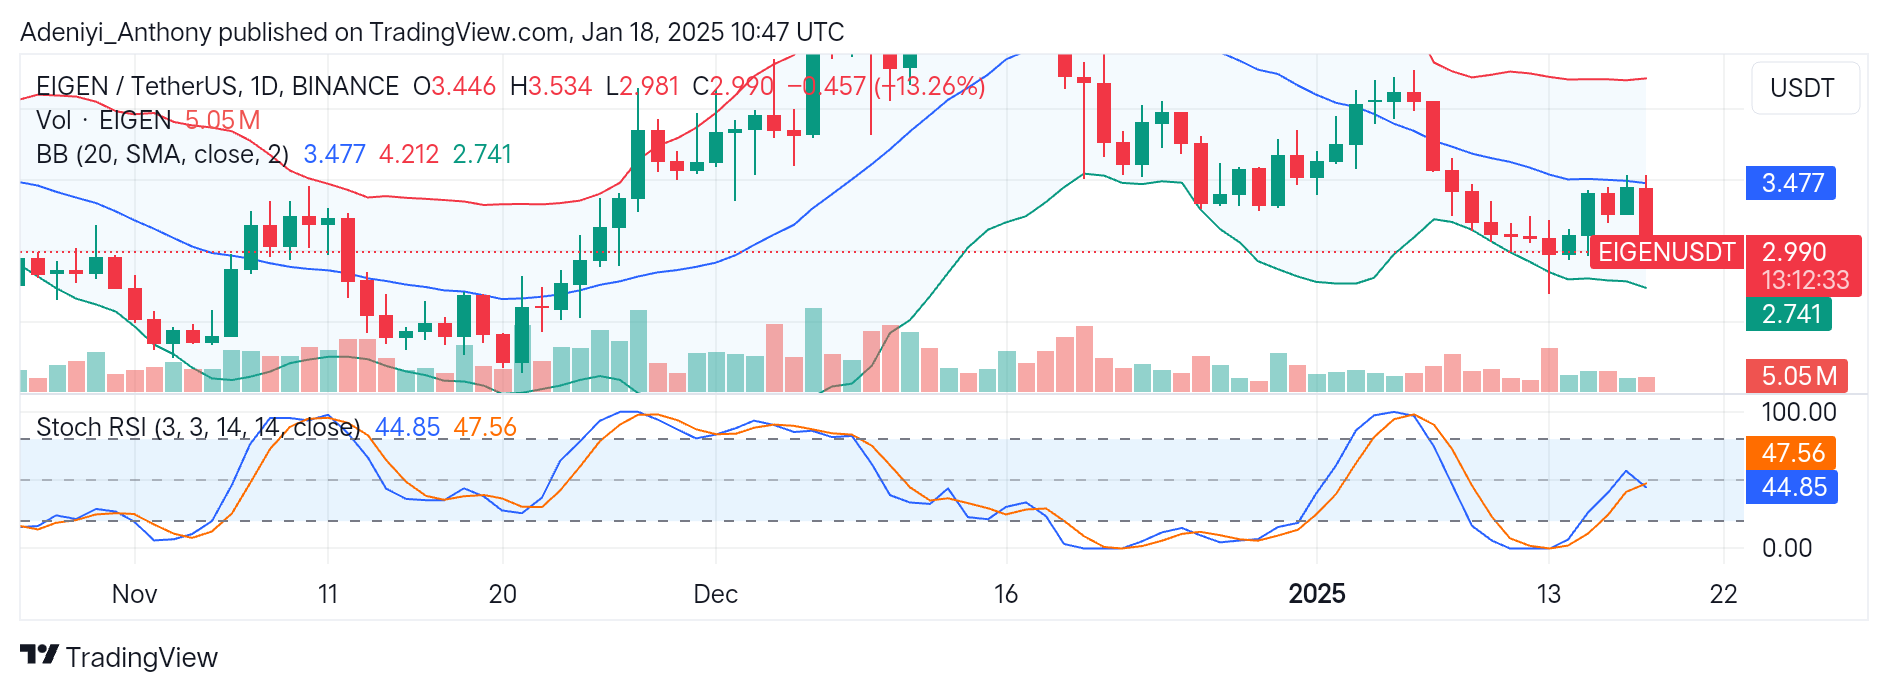
EigenLayer against the Tether on the daily timeframe has experienced a prolonged downtrend in recent days. After a previous retracement attempt at the mid-band, the pair has failed to break above the $3.477 resistance level.
However, recent price actions show the pair is experiencing a sharp decline, appearing that bearish traders are dominating the market with a 13.36 drop in price from the opening point.
To this end, EIGEN, according to the Stochastic RSI, operates in the neutral zone, suggesting a possible move in either direction.
Currently, EigenLayer is trading at $2.990 with over 5 million trades in volume.
Technical Indicators
Major Resistance Levels: $3.477, $3.530, and $4.212
Major Support Levels: $2.980, $2.741, and $2.600
EigenLayer Technical Analysis
During the daily timeframe, EigenLayer against the Tether has been experiencing a downtrend, as evidenced by the formation of lower highs and lows. However, recent price actions show that price declines further after failing to hold above the mid-Bollinger band.
As evidenced by the appearance of the red candlestick and the price position between the lower segment of the Bollinger bands, the bearish traders dominate the market.
On the other hand, the Stochastic RSI signals the price’s potential to move in either direction, as the lines operate slightly below the 50-mark level.
To this end, if the price fails to hold above $2.980, EIGEN/USDT may see further price dips. Conversely, with the appearance of the oscillator, the pair may retest the $3.477 level if a significant volume of bullish trades occurs.
EIGEN/USDT Analysis: Expectations
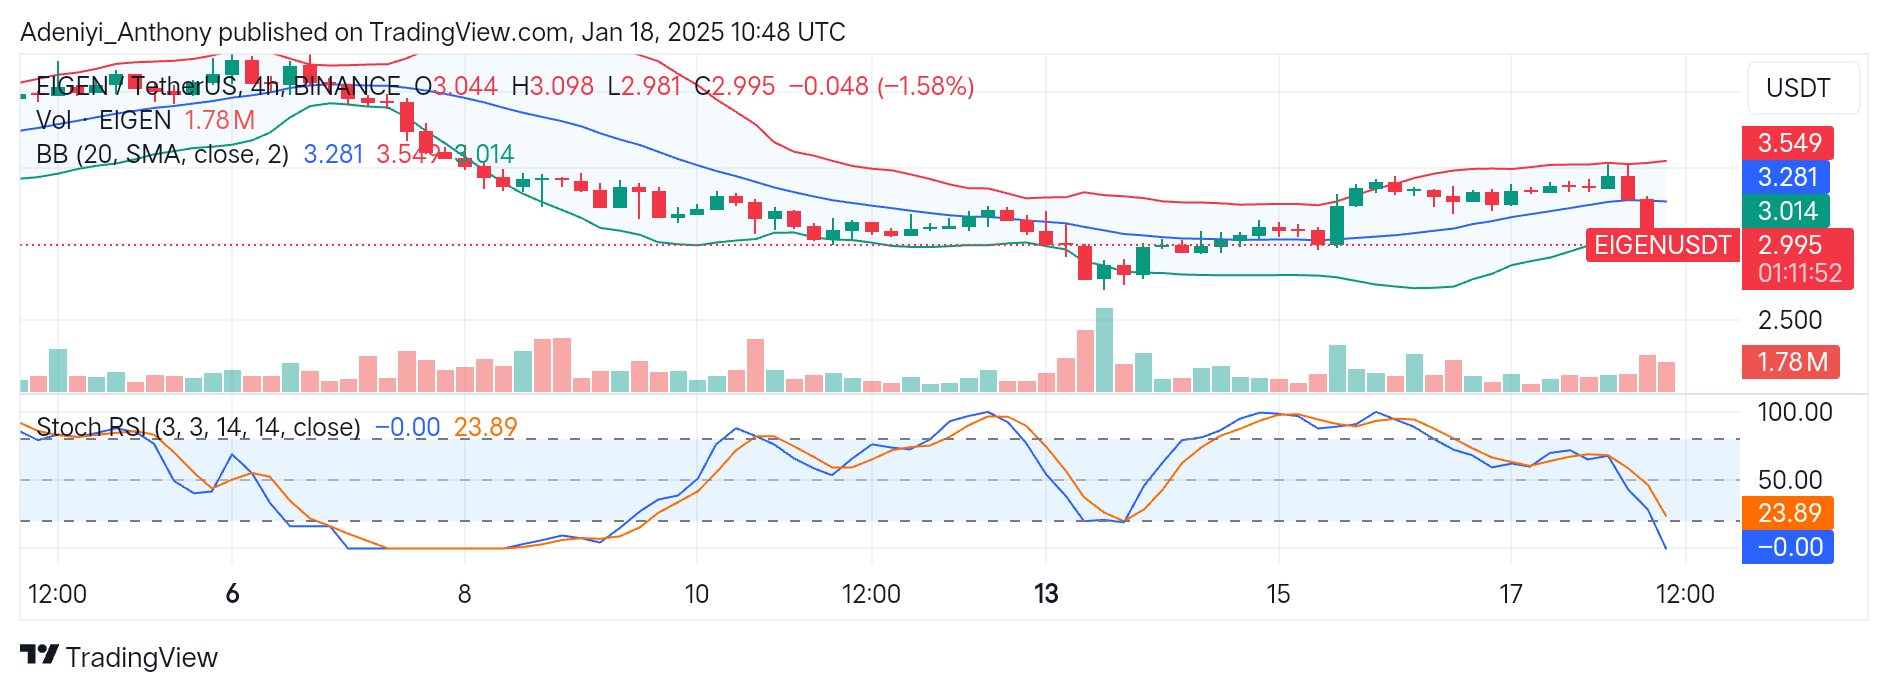
On the 4-hour chart, the analysis shows that EIGEN/USDT is trending down, represented by a 1.58% dip in price. The Bollinger bands appear to be shrinking, with the price underneath the lower band. This suggests an impending volatility in the near term.
However, the oversold Stochastic condition indicates a potential rebound is on the horizon if buyers step in. To this end, continuing current momentum would suggest a move towards $2.741, while a break above the lower band would indicate a rebound to $3.281 is possible.
You can purchase crypto coins here. Buy LBlock