Solana (SOL/USD) Market Continues to Rise Above $30
Estimated Reading Time: 3 minutes
Don’t invest unless you’re prepared to lose all the money you invest. This is a high-risk investment and you are unlikely to be protected if something goes wrong. Take 2 minutes to learn more
Solana Price Prediction – November 4
A correction has emanated in the SOL/USD trade operations and got exhausted to produce a situation that portrays that the crypto market continues to rise above the $30 line. The market has been actively buying and selling between the high and low of $32.66 and $30.67, keeping 4.34 percent positive.
SOL/USD Market
Key Levels:
Resistance levels: $35, $40, $45
Support levels: $25, $20, $15
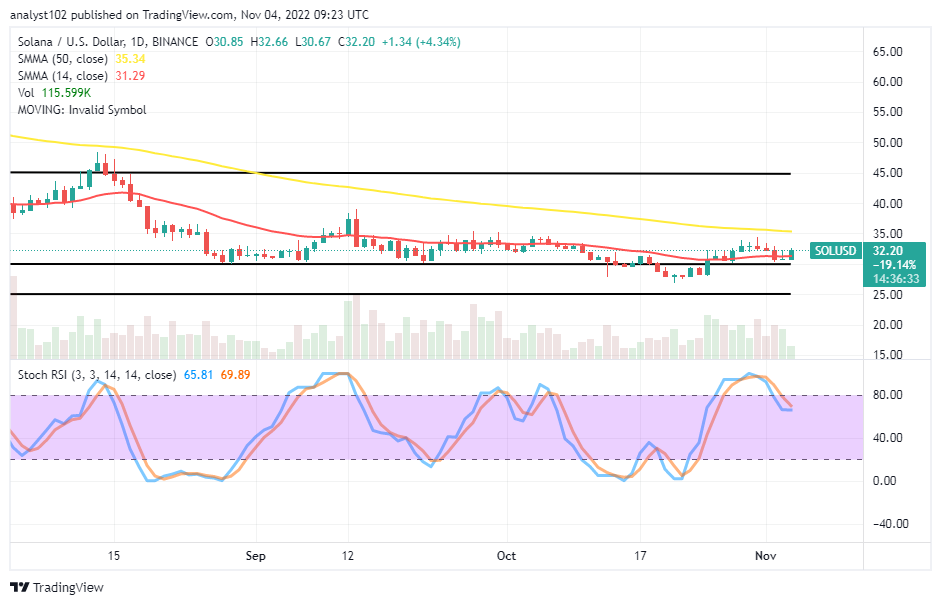
SOL/USD – Daily Chart
The SOL/USD daily chart showcases the crypto market continues to rise above the $30 trading level after a line of retracements not to extend southwardly past it. The 14-day SMA indicator is at $31.29, underneath the $35.34 value point of the 50-day SMA indicator. The Stochastic Oscillators tempted to close their lines at 65.81 and 69.89 range values. And with the formation of a bullish candlestick indicates a buying motion is ongoing.
Will the SOL/USD trade soon surpass the $35 resistance level in terms of valuation?
Expectantly, the SOL/USD trade operation may increase its valuation beyond the $35 resistance level as the crypto market continues to rise above the $30 point. As it has been, the current formation of a trading candlestick is spanning northward. To ensure buying binge holds for further ups, it need not reverse against its base point. Bulls in this market are to exhaust their capacity at least to the resistance point of the amount in question.
On the downside of the technical analysis, there can be a repetition of an early retracement moving process against the trending power of the smaller SMA with a formation of a bearish candlestick to serve as a wall to the following downs. Sellers should concern about the market surging higher past the trend line of the bigger SMA. A sustained break out of the indication will allow the price to strive for a position near the $40 trading resistance level.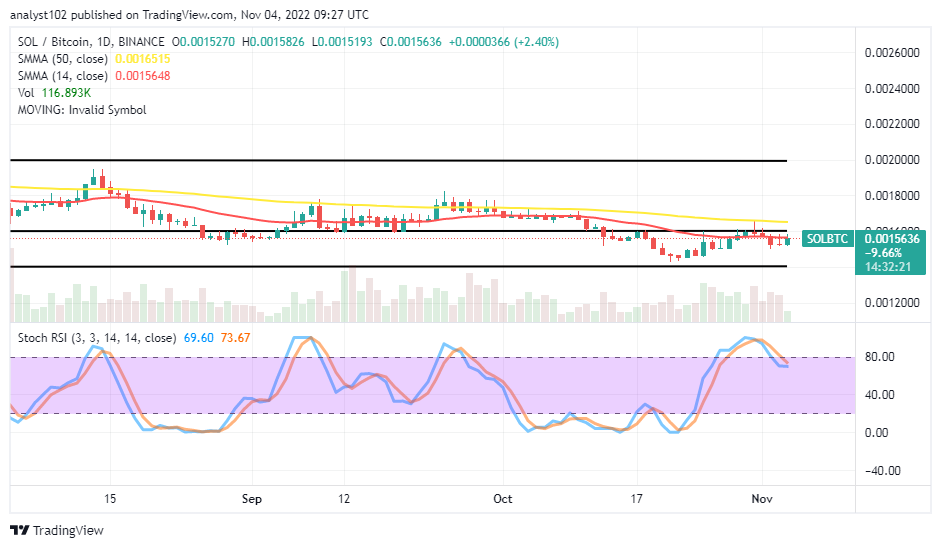
SOL/BTC Price Analysis
In comparison, Solana is holding stances against the trending ability of Bitcoin around the trend line of the smaller SMA. The price of the cryptocurrency pair market marginally rises over the larger SMA trend line, demonstrating that the former trading instrument is about to struggle to outweigh its later trading instrument at a lower-high-based view. The 14-day SMA is underneath the 50-day SMA. The Stochastic Oscillators have curved southbound from the overbought region, trying to close their lines back to the upside at 69.60 and 73.67 range values. That shows the base crypto is trying to push back northwardly against its counter-trading crypto.
Note: Cryptosignals.org is not a financial advisor. Do your research before investing your funds in any financial asset or presented product or event. We are not responsible for your investing results.
You can purchase Lucky Block here. Buy LBLOCK