Ethereum (ETH) Trades Marginally, Resumes Downward Move
Estimated Reading Time: 2 minutes
Don’t invest unless you’re prepared to lose all the money you invest. This is a high-risk investment and you are unlikely to be protected if something goes wrong. Take 2 minutes to learn more
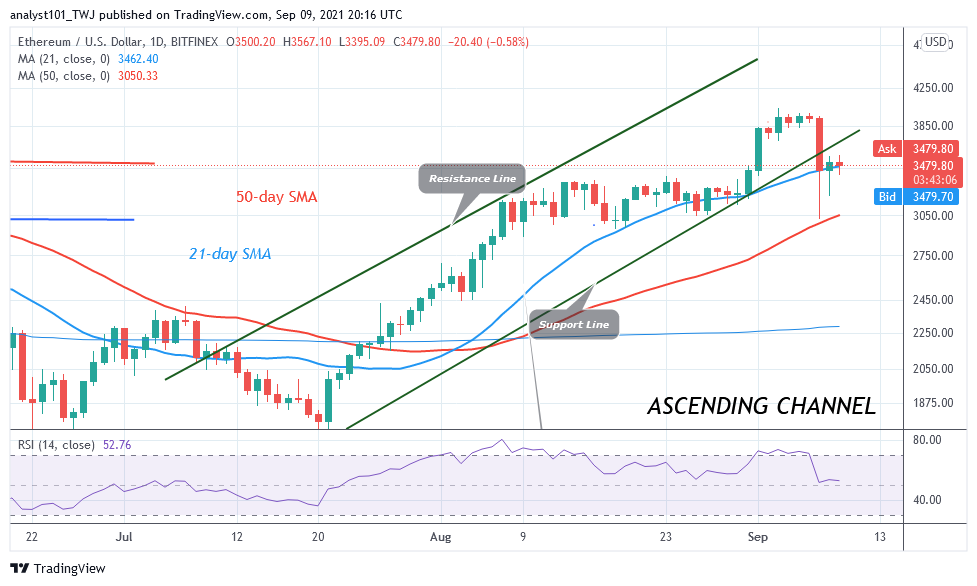

Ethereum Price Long-Term Analysis: Bearish
Following, the breakdown on September 7, Ethereum’s (ETH) price has been consolidating above the $3,000 support. Today, the market has resumed its downward move after facing rejection at the $3,500 resistance zone. On the daily chart, the price has broken the 21-day SMA but approaches the 50-day SMA. A break below the moving averages will mean further downsides.
Ethereum Indicator Analysis
The biggest altcoin is at level 52 of the Relative Strength index period 14. It indicates that the crypto is in the uptrend zone and above the centerline 50. It is also capable of rising on the upside. Ether is above the 50% range of the daily stochastic. This bullish momentum is contrary to the current price action. That is, the market is declining as the altcoin faces rejection.
Technical indicators:
Major Resistance Levels – $4, 000, $4,200, $4,400
Major Support Levels – $2.500, $2, 300, $2,100
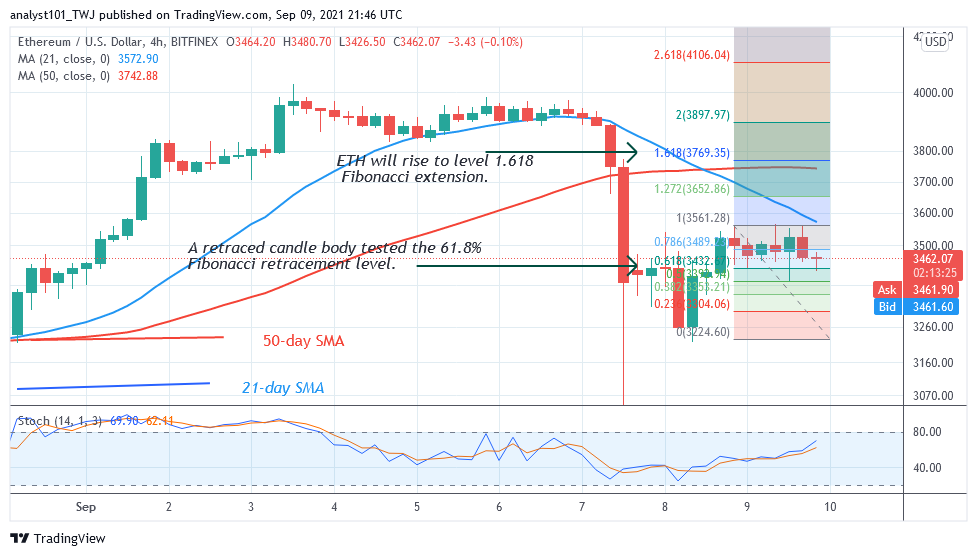
What Is the Next Direction for Ethereum?
Ethereum is in a downward correction. The uptrend will resume if price breaks above the $3,500 resistance zone. Meanwhile, on September 8 uptrend; a retraced candle body tested the 61.8% Fibonacci retracement level. The retracement indicates that ETH is likely to rise to level 1.618 Fibonacci extension or level $3,769.35.
You can purchase crypto coins here. Buy Token
Note: Cryptosignals.org is not a financial advisor. Do your research before investing your funds in any financial asset or presented product or event. We are not responsible for your investing results