Ethereum (ETH) In a Sideways Move, Revisits Previous Low above $3070
Don’t invest unless you’re prepared to lose all the money you invest. This is a high-risk investment and you are unlikely to be protected if something goes wrong. Take 2 minutes to learn more

Ethereum Price Long-Term Analysis: Bullish
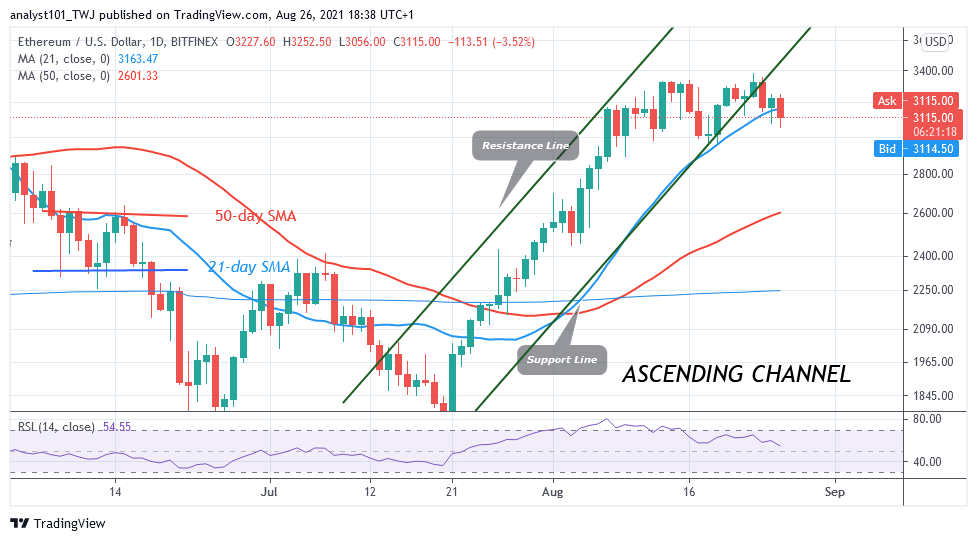
Ethereum (ETH) has been in a downward move for the past three days. Today, the biggest altcoin plunged to the low of $3,076 as bulls buy the dips. There are bullish candlesticks above the $3,100 support. Ether will resume upside momentum if the current support holds. Meanwhile, since August 13, buyers have not been able to push above the $3,400 resistance. For the past week, Ether has been in a sideways move below the $3,400 overhead resistance. A break above $3,400 will catapult the altcoin to $4,000 high
Ethereum Indicator Analysis
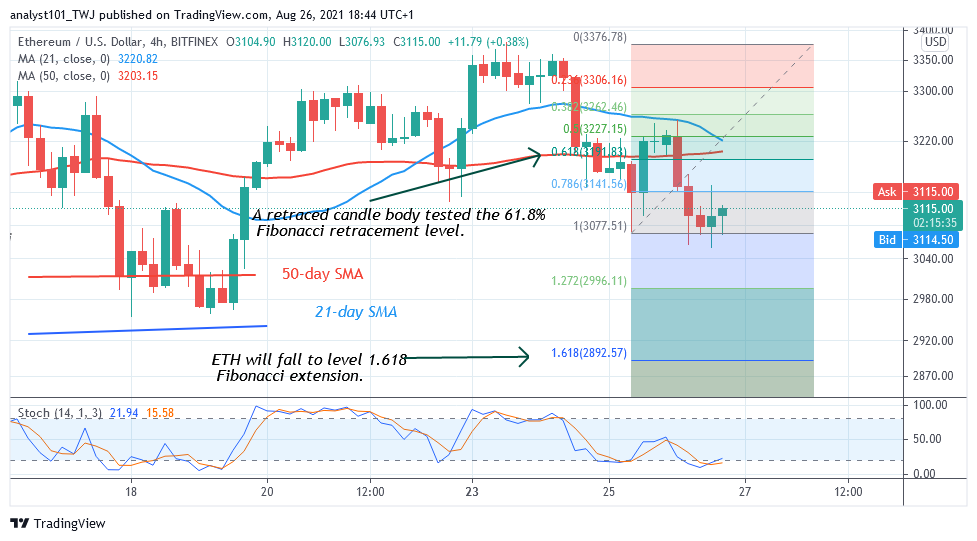
Ether has fallen to level 54 of the Relative Strength index period 14. It indicates that the crypto is in the bullish trend zone and above the centerline 50. Ether has fallen below the 20% range of the daily stochastic. It indicates that the crypto is now in the oversold region of the market. Buyers are expected to emerge in the oversold region to push Ether upward.
Technical indicators:
Major Resistance Levels – $3, 600, $3,800, $4,000
Major Support Levels – $2.500, $2, 300, $2,100
What Is the Next Direction for Ethereum?
Ethereum is in a downward move but the selling pressure is likely to have subsided. Meanwhile, on August 25 downtrend; a retraced candle body tested the 61.8% Fibonacci retracement level. The retracement indicates that ETH is likely to fall to level 1.618 Fibonacci extension or level $2,892.57. From the price action, Ether has resumed upward above level $3070 support.
You can purchase crypto coins here. Buy Token
Note: Cryptosignals.org is not a financial advisor. Do your research before investing your funds in any financial asset or presented product or event. We are not responsible for your investing results