Lucky Block Price Prediction: LBLOCK/USD Prepares for Breakout at $0.0045
Estimated Reading Time: 2 minutes
Don’t invest unless you’re prepared to lose all the money you invest. This is a high-risk investment and you are unlikely to be protected if something goes wrong. Take 2 minutes to learn more

Free Crypto Signals Channel
The Lucky Block price prediction remains below the 9-day and 21-day moving averages as the price prepares for a bullish breakout.
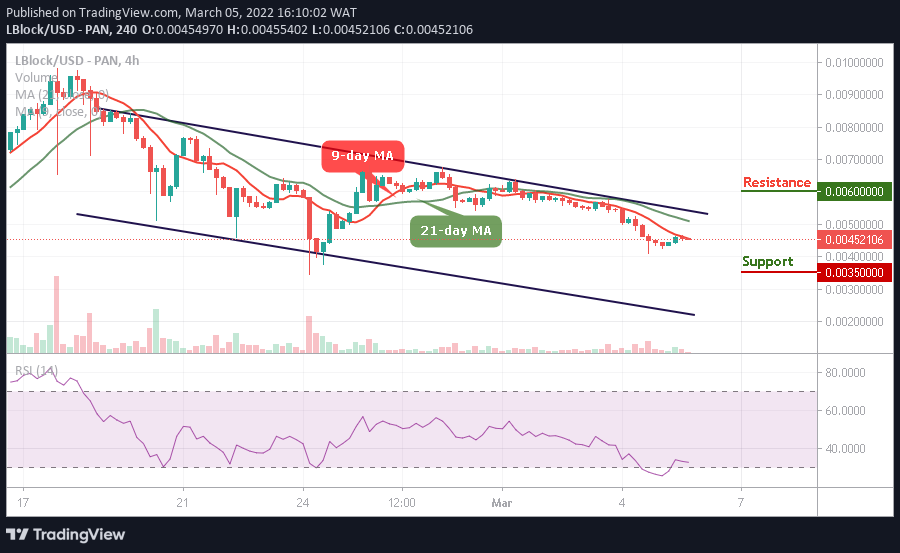
LBLOCK/USD Medium-term Trend: Bearish (4 Hour Chart)
Key Levels:
Resistance levels: $0.0060, $0.0065, $0.0070
Support levels: $0.0035, $0.0030, $0.0025
LBLOCK/USD is trading around $0.00452 as the coin may give room for new buyers to come into the market and the existing buyers to re-invest. Therefore, if the sellers continue to push the market further lower once again, bears can expect immediate support to be located at the $0.0040 level for more buyers to surface.
Lucky Block Price Prediction: LBLOCK Ready for the Upside
According to the 4-hour chart, the Block Lucky price stays below the 9-day and 21-day moving averages. The coin may prepare to fall more as the technical indicator Relative Strength Index (14) keeps moving below 40-level. Any further bearish movement could locate the supports at $0.0035, $0.0030, and $0.0025.
In other words, if the buyers can hold the current market value and push above the moving averages, bulls can then expect immediate resistance at $0.0055. However, crossing above the upper boundary of the channel, higher resistance may be found at $0.0060, $0.0065, and $0.0070 levels.
LBLOCK/USD Medium-term Trend: Bearish (2 Hour Chart)
On the 2-hour chart, the Lucky Block (LBLOCK) moves around the 9-day moving average as the buyers are coming into the market which could bring the coin to cross above the 21-day moving average. LBLOCK/USD is trading at $0.0044.
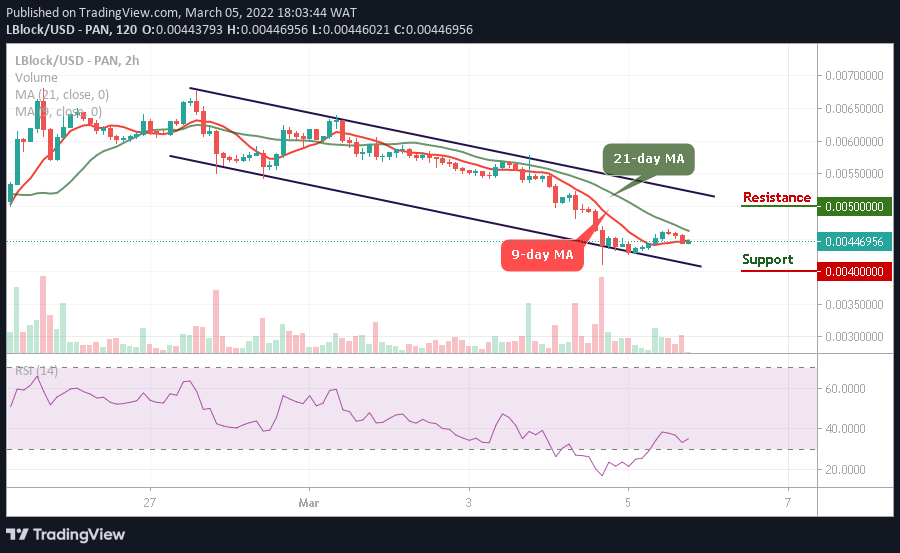
Looking at the upside, the buyers are getting ready to spike towards the upper boundary of the channel, higher resistance could lie at $0.0050 and above, but any further bearish movement could hit the support at $0.0040 and below as the technical indicator Relative Strength Index (14) stays around 35-level.
Read more: