XRP’s Price Fluctuates in a Range Below $0.64
Estimated Reading Time: 2 minutes
Don’t invest unless you’re prepared to lose all the money you invest. This is a high-risk investment and you are unlikely to be protected if something goes wrong. Take 2 minutes to learn more

XRP (XRP) Long-Term Analysis: Bearish
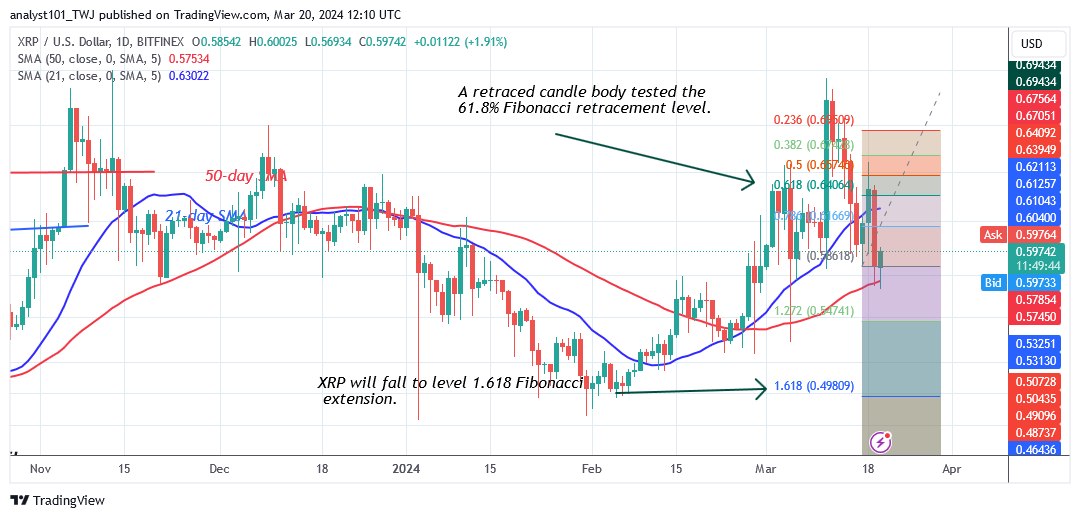
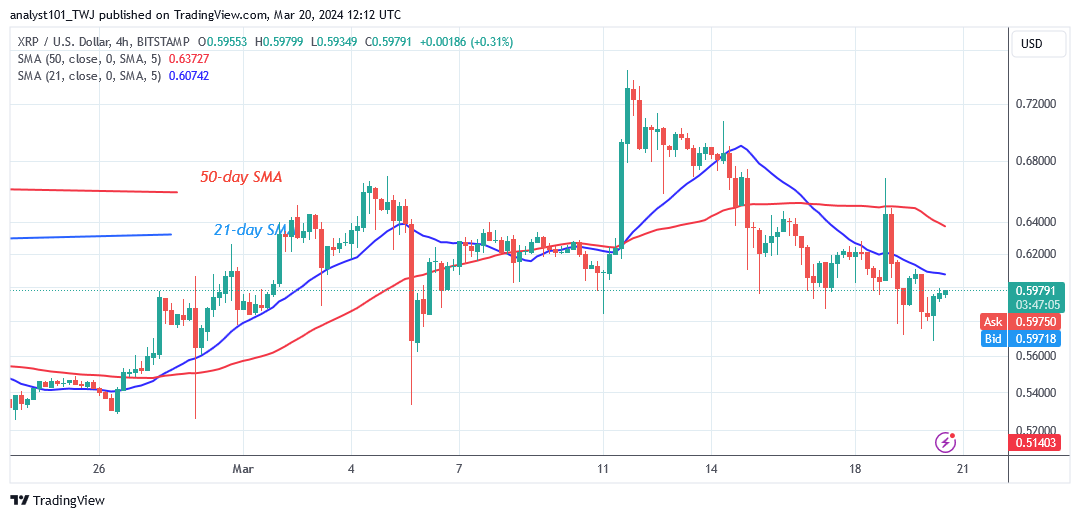
The XRP (XRP) price has dropped between the moving average lines as it fluctuates in a range below $0.64. The altcoin soared to a high of $0.74 before falling back down. Since November 13, 2023, buyers have been unable to continue bullish momentum above the $0.75 high. XRP has experienced strong resistance at high price levels.
On the downside, the bears crossed the 21-day SMA twice, trapping the altcoin between the moving average lines. The bulls stopped the drop above the 50-day SMA, and XRP remained above it. On the downside, if the bears break below the 50-day SMA, the market will fall above its $0.49 low. Meanwhile, XRP/USD is currently priced at $0.59.
Technical Indicators:
Major Resistance Levels – $1.00, $1.50, $2.00
Major Support Levels – $0.50, $0.30, $0.10
XRP (XRP) Indicator Analysis
The moving average lines have restricted the price movement of XRP. The cryptocurrency is swinging as bulls and bears continue to battle between the moving average lines. On the 4-hour chart, the price bars are lower than the moving average lines, indicating an early decrease.
What Is the Next Direction for XRP (XRP)?
On the 4-hour chart, XRP is declining but fluctuates in a range below $0.64. The price indicator suggests that XRP will fall further to the 1.618 Fibonacci extension, or $0.49. In this situation, the crypto signal remains negative until the altcoin resumes its bullish ascent.
You can purchase crypto coins here. Buy LBLOCK
Note: Cryptosignals.org is not a financial advisor. Do your research before investing your funds in any financial asset or presented product or event. We are not responsible for your investing results