The dYdX market (DYDX/USD) Set to Break A Long Standing Resistance Level
Estimated Reading Time: 3 minutes
Don’t invest unless you’re prepared to lose all the money you invest. This is a high-risk investment and you are unlikely to be protected if something goes wrong. Take 2 minutes to learn more

Since the emergence of the $2.00 and $1.80 price levels as support, the $2.20 price level has consistently acted as a resistance barrier, preventing further upward movement in the market. This resistance has been a significant obstacle for the bull market since early May. Both support and resistance levels have remained robust, effectively containing market progress.
However, in today’s market, we observe bullish momentum approaching the critical $2.20 resistance level once again, with the current price standing close at $2.16. The price action has reached this key resistance, indicating the presence of bearish pressure, resulting in a slight pullback.
The dYdX Market Data
- DYDX/USD Price Now: $2.16
- DYDX/USD Market Cap: $1.3 million
- DYDX/USD Circulating Supply: 594 million DYDX
- DYDX/USD Total Supply: 766 million DYDX
- DYDX/USD CoinMarketCap Ranking: #74
Key Levels
- Resistance: $2.20, $2.25, and $2.30
- Support: $2.10, $2.00, and $1.90.
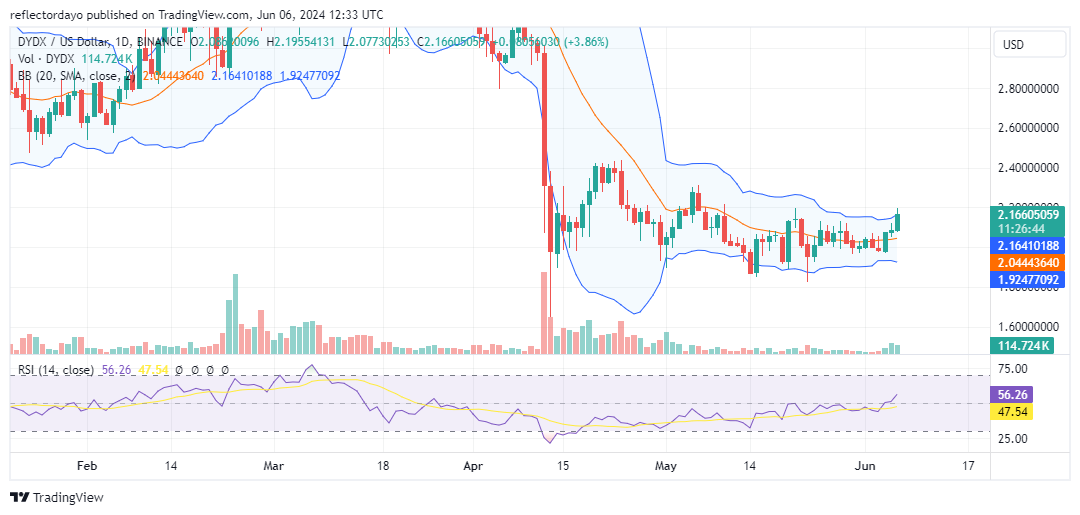
The dYdX Market Through the Lens of Indicators
The dYdX market experienced a significant increase in bullish momentum around mid-March, leading to a peak at the $4.40 price level. This strong bullish run created an opportunity for a subsequent intense bearish trend, which easily broke through the key support level that had previously facilitated the rally to $4.40. Eventually, a new support level emerged at $2.00.
The aftermath of this substantial sell-off resulted in a range-bound trend, with prices fluctuating between $2.00 and $2.20 since May. The Relative Strength Index (RSI), which measures market momentum, had been below 50 following the dramatic decline in March. However, the current crypto signals now show price action emerging above the 20-day moving average, with the RSI currently at 56, indicating improving momentum.
Despite this, the bulls face a significant challenge as bearish resistance remains firmly in place at the $2.20 level, a longstanding barrier. Breaking through this resistance could potentially trigger another wave of substantial buying, propelling the market upward as it did in March.
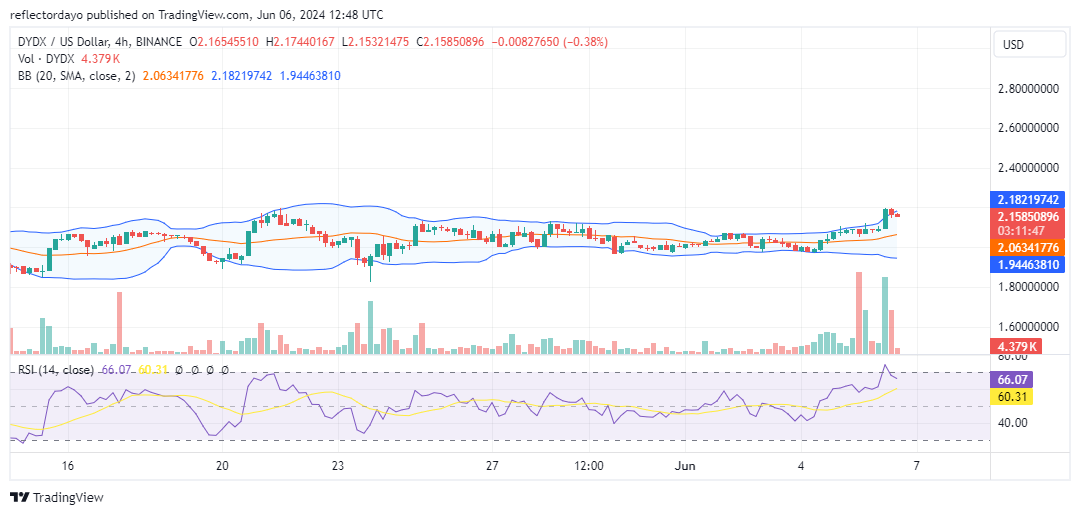
DYDX/USD Price Prediction: 4-Hour Chart Analysis
Currently, the dYdX market, as observed from the 4-hour chart, suggests that the bulls may still maintain their strength, which could sustain the bullish trend. Initially, as the market surged towards the key resistance level with a significant volume of trades, the price became constrained at the $2.20 level, where bullish momentum met bearish resistance and as a result of the gridlock at this level, the volume of trade is on the decline. The decline in the volume of trade hints at the possibility of consolidation at the crucial $2.20 price level. The market’s future direction remains uncertain and will unfold over time.