Lucky Block Price Prediction: LBLOCK/USD Trades Around $0.000115
Estimated Reading Time: 3 minutes
Don’t invest unless you’re prepared to lose all the money you invest. This is a high-risk investment and you are unlikely to be protected if something goes wrong. Take 2 minutes to learn more
Lucky Block Price Prediction – September 3
The Lucky Block shows that LBLOCK is yet to cross above the channel’s upper boundary as the coin needs to reclaim previous resistance.
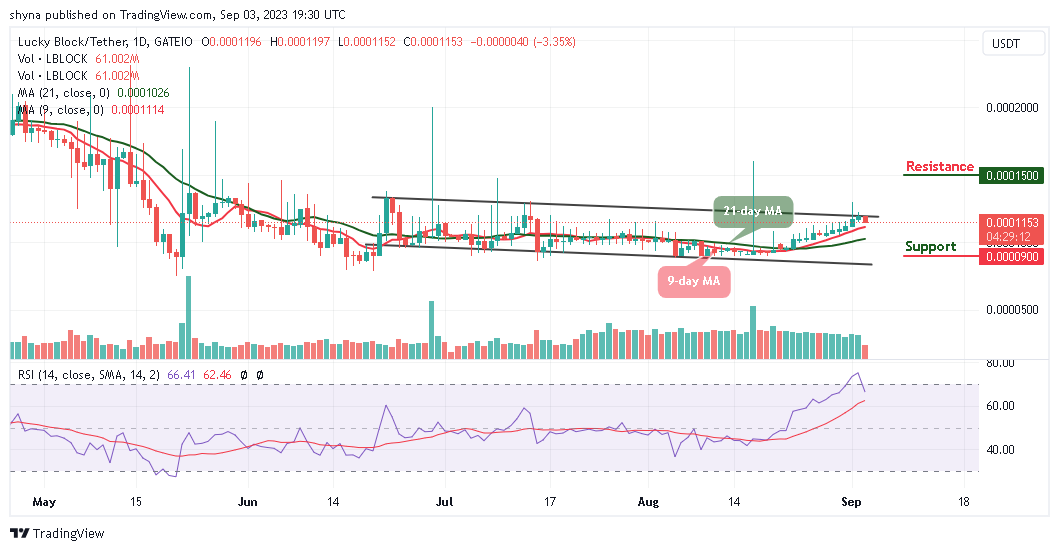
LBLOCK/USD Long-term Trend: Ranging (1D Chart)
Key Levels:
Resistance levels: $0.000150, $0.000160, $0.000170
Support levels: $0.000090, $0.000080, $0.000070
LBLOCK/USD is hovering above the 9-day and 21-day moving averages as the price remains around $0.000115 with the intraday price fluctuations. Today, the Lucky Block price began the day at $0.000119 level but later dropped to where it is currently trading.
Lucky Block Price Prediction: Would Lucky Block Break to the Upside?
The daily chart reveals that buyers are making a serious effort to push the Lucky Block price above the upper boundary of the channel. Meanwhile, if the bulls succeed, the nearest resistance level could be at $0.000130 and a further bullish movement may take the price to the potential resistance levels at $0.000150, $0.000160, and $0.000170.
On the contrary, if LBLOCK/USD drops below the 9-day and 21-day moving averages, the next key support can be at $0.000110, and should the bulls fail to hold this support level; the price may further swing to the supports at $0.000090, $0.000080, and $0.000070. Nevertheless, the Relative Strength Index (14) is currently facing the south, suggesting a bearish movement so that new buyers can come into the market.
LBLOCK/USD Medium-term Trend: Bullish (4H Chart)
On the 4-hour chart, the Lucky Block price is sliding below the 9-day and 21-day moving averages. Its performance has been very low due to a recurring bearish sentiment causing the market to fall gradually. Meanwhile, the price actions remain choppy as the coin has been following the bearish movement for the last couple of days.
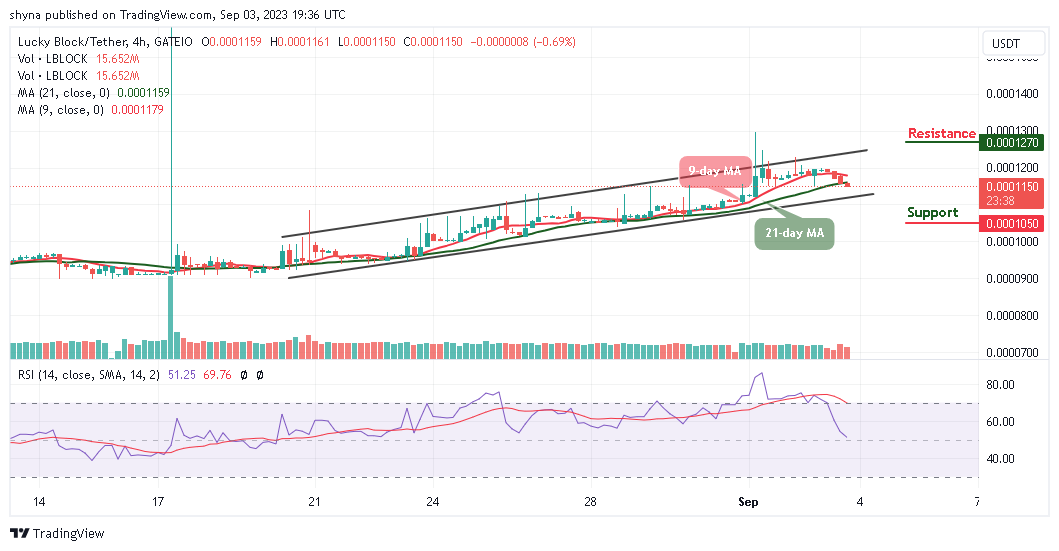
However, as the market is bearish, traders have to be on the watch for the possible next direction. For a positive upsurge, the coin may spike above the 9-day and 21-day moving averages to hit the resistance level of $0.000127. Meanwhile, a negative spike could retest the important support at $0.000110 before a possible slip to $0.000105 and below, but the Relative Strength Index (14) is moving to cross below the 50-level, indicating a bearish movement as it could be a good opportunity for more buyers to invest in the coin.
You can purchase Lucky Block here. Buy LBLOCK